

Question: Quality control has been a problem with a new product assembly line, and a multiple regression analysis is being used to help identify the source
Quality control has been a problem with a new product assembly line, and a multiple regression analysis is being used to help identify the source of the trouble. The daily ?percent defective? has been identified as the Y variable, to be predicted from the following variables that were considered by some workers to be likely causes of trouble: the ?percent overscheduled? (a measure of the extent to which the system is being worked over and above its capacity), the ?buffer inventory level? (the extent to which stock builds up between workstations), and the ?input variability? (the standard deviation of the weights for a key input component). Based on the multiple regression output in Table 12.5.13, where should management action be targeted? Explain your answer in the form of a memo to your supervisor.?
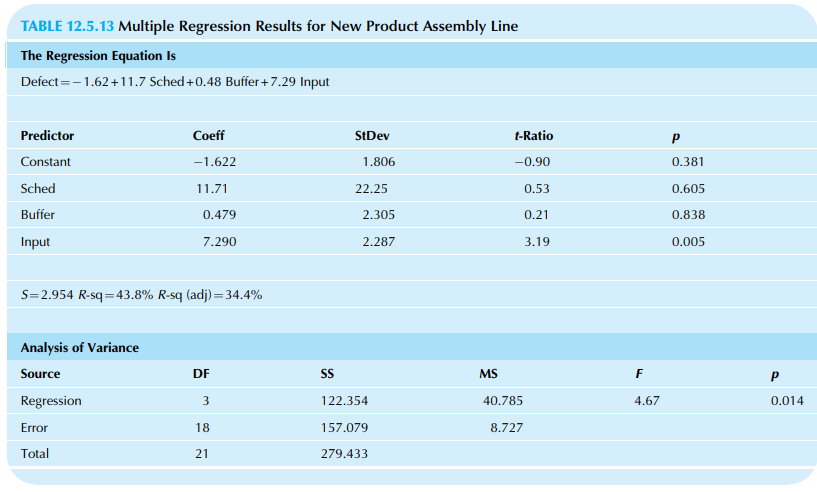
TABLE 12.5.13 Multiple Regression Results for New Product Assembly Line The Regression Equation Is Defect =-1.62+11.7 Sched +0.48 Buffer +7.29 Input Predictor Coeff StDev t-Ratio Constant -1.622 1.806 -0.90 0.381 Sched 11.71 22.25 0.53 0.605 Buffer 0.479 2.305 0.21 0.838 Input 7.290 2.287 3.19 0.005 S=2.954 R-sq=43.8% R-sq (adj)=34.4% Analysis of Variance Source DF SS MS F Regression 3 122.354 40.785 4.67 0.014 Error 18 157.079 8.727 Total 21 279.433
Step by Step Solution
3.45 Rating (165 Votes )
There are 3 Steps involved in it
Using ANOVA Table we have the following hypothesis Null Hypothesis Ho The overall Regression is not ... View full answer

Get step-by-step solutions from verified subject matter experts