

Question: Tables 9.1, 9.3, and 9.5 in the previous chapter present Inditexs financial statements for years 2015 and 2016. Use the information in these tables to
Tables 9.1, 9.3, and 9.5 in the previous chapter present Inditex’s financial statements for years 2015 and 2016. Use the information in these tables to answer the following questions:
a. What is Inditex’s sustainable growth rate for year 2016?
b. How does this compare with the actual growth rate for the same year?
Table 9.1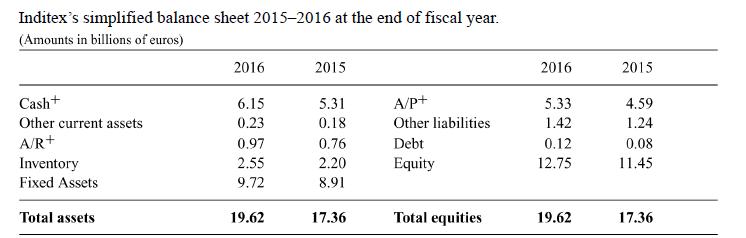
Inditex's simplified balance sheet 2015-2016 at the end of fiscal year. (Amounts in billions of euros) 2016 2015 2016 2015 Cash+ 6.15 5.31 A/P+ 5.33 4.59 Other current assets 0.23 0.18 Other liabilities 1.42 1.24 A/R+ 0.97 0.76 Debt 0.12 0.08 Inventory 2.55 2.20 Equity 12.75 11.45 Fixed Assets 9.72 8.91 Total assets 19.62 17.36 Total equities 19.62 17.36
Step by Step Solution
3.43 Rating (150 Votes )
There are 3 Steps involved in it

Get step-by-step solutions from verified subject matter experts