

Question: 8. The table below shows socio-economic data for a selection of countries for the year 2009,16 using the following features: COUNTRY: The name of the
8. The table below shows socio-economic data for a selection of countries for the year 2009,16 using the following features:
COUNTRY: The name of the country LIFEEXPECTANCY: The average life expectancy (in years)
INFANTMORTALITY: The infant mortality rate (per 1,000 live births)
EDUCATION: Spending per primary student as a percentage of GDP HEALTH: Health spending as a percentage of GDP HEALTHUSD: Health spending per person converted into US dollars
a. Calculate the correlation between the LIFEEXPECTANCY and INFANTMORTALITY features.
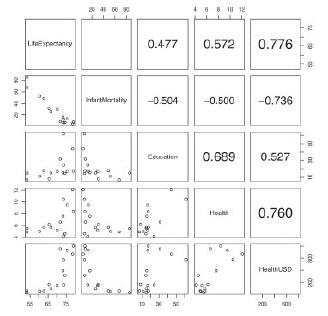
b. The image below shows a scatter plot matrix of the continuous features from this dataset (the correlation between LIFEEXPECTANCY and INFANTMORTALITY has been omitted). Discuss the relationships between the features in the dataset that this scatter plot highlights
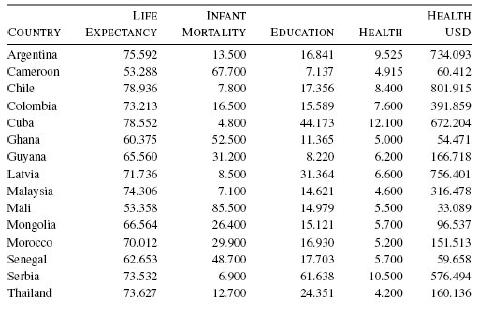
LIFE INFANT HEALTH COUNTRY EXPECTANCY MORTALITY EDUCATION HEALTH USD Argentina 75.592 13.500 16.841 9.525 734.093 Cameroon 53.288 67.700 7.137 4.915 60.412 Chile 78.936 7.800 17.356 8.400 801.915 Colombia 73.213 16.500 15.589 7.600 391.859 Cuba 78.552 4.800 44.173 12.100 672.204 Ghana 60.375 52.500 11.365 5.000 54.471 Guyana 65.560 31.200 8.220 6.200 166.718 Latvia 71.736 8.500 31.364 6.600 756.401 Malaysia 74.306 7.100 14.621 4.600 316.478 Mali 53.358 85.500 14.979 5.500 33.089 Mongolia 66.564 26.400 15.121 5.700 96.537 Morocco 70.012 29.900 16.930 5.200 151.513 Senegal 62.653 48.700 17.703 5.700 59.658 Serbia 73.532 6.900 61.638 10.500 576.494 Thailand 73.627 12.700 24.351 4.200 160.136
Step by Step Solution
There are 3 Steps involved in it

Get step-by-step solutions from verified subject matter experts