

Question: With the aid of the Smith chart, plot a curve of |Z in | versus l for the transmission line shown in Figure 10.33. Cover
With the aid of the Smith chart, plot a curve of |Zin| versus l for the transmission line shown in Figure 10.33. Cover the range 0 < l/λ < 0.25.
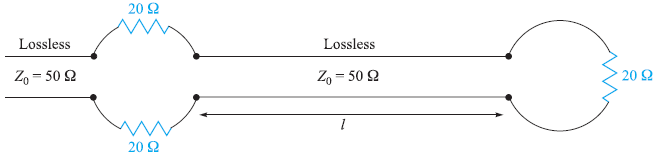
20 Lossless Lossless 20 Zo = 50 2 Zo = 50 2 20 2
Step by Step Solution
★★★★★
3.44 Rating (170 Votes )
There are 3 Steps involved in it
1 Expert Approved Answer
Step: 1 Unlock

The required input impedance is that at the actual line input to the left of the two 20 resistors The input to the line section occurs just to the rig... View full answer
Question Has Been Solved by an Expert!
Get step-by-step solutions from verified subject matter experts
Step: 2 Unlock
Step: 3 Unlock