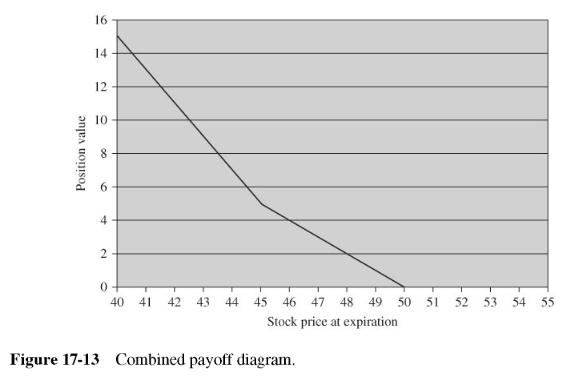
The payoff diagram in Figure 17-13 represents what combination of positions? a. Long put at $45 and
Question:
The payoff diagram in Figure 17-13 represents what combination of positions?
a. Long put at $45 and long put at $50
b. Long put at $45 and short call at $50
c. Short put at $45 and long put at $50
d. Short put at $45 and short call at $50

Fantastic news! We've Found the answer you've been seeking!
Step by Step Answer:
Related Book For 

Question Posted:


