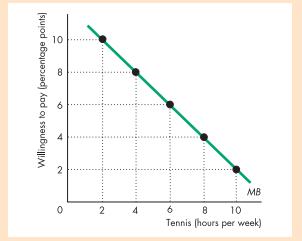
*5 Peter, in problem 1, has the marginal benefit curve shown in the graph at the top...
Question:
*5 Peter, in problem 1, has the marginal benefit curve shown in the graph at the top of the next column:

a If Peter is efficient, what his mark? b Why would Peter be worse off getting a higher mark?
Fantastic news! We've Found the answer you've been seeking!
Step by Step Answer:
Related Book For 

Question Posted:


