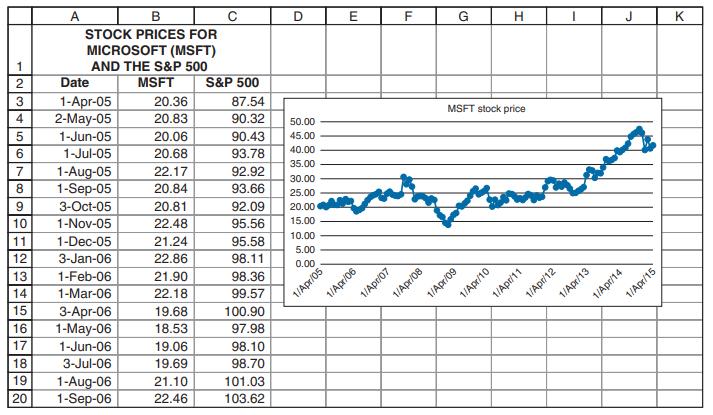
Graph the MSFT prices so that the resulting spreadsheet looks like the following: A B STOCK PRICES
Question:
Graph the MSFT prices so that the resulting spreadsheet looks like the following:
![image text in transcribed](https://dsd5zvtm8ll6.cloudfront.net/images/question_images/1717/7/3/9/02066629e0cf11e91717739018438.jpg)
Transcribed Image Text:
A B STOCK PRICES FOR MICROSOFT (MSFT) AND THE S&P 500 D E F G H K 1 2 Date MSFT S&P 500 3 1-Apr-05 20.36 87.54 4 2-May-05 20.83 90.32 50.00 5 1-Jun-05 20.06 90.43 45.00 6 1-Jul-05 20.68 93.78 40.00 35.00 7 1-Aug-05 22.17 92.92 30.00 8 1-Sep-05 20.84 93.66 25.00 9 3-Oct-05 20.81 92.09 20.00 10 1-Nov-05 22.48 95.56 15.00 11 1-Dec-05 21.24 10.00 95.58 5.00 12 3-Jan-06 22.86 98.11 0.00 13 1-Feb-06 21.90 98.36 14 1-Mar-06 22.18 99.57 15 3-Apr-06 19.68 100.90 16 1-May-06 18.53 97.98 17 1-Jun-06 19.06 98.10 18 3-Jul-06 19.69 98.70 19 1-Aug-06 21.10 101.03 20 1-Sep-06 22.46 103.62 1/Apr/05 1/Apr/06 1/Apr/07 1/Apr/08 1/Apr/09 1/Apr/10 1/Apr/11 1/Apr/12 1/Apr/13 1/Apr/14 1/Apr/15 MSFT stock price
Question Posted: