

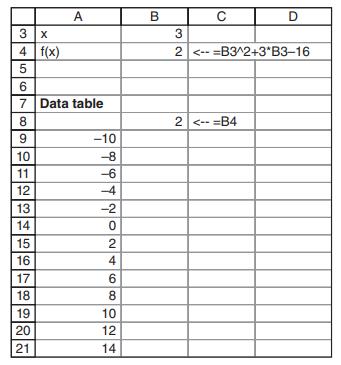
The spreadsheet below shows the value of the function f (x x ) = + x
Question:
The spreadsheet below shows the value of the function f (x x ) = + x − 2 3 16 for x = 3.
Create the indicated data table and use it to graph the function in the range (–10, 14).
Step by Step Answer:

This question has not been answered yet.
You can Ask your question!
Related Book For 

Principles Of Finance Wtih Excel
ISBN: 9780190296384
3rd Edition
Authors: Simon Benninga, Tal Mofkadi
Question Posted:
