

Question: The following code was used to generate the graphs in Figure 9.3. ?Modify the code to illustrate the strong law of large numbers ?for an
The following code was used to generate the graphs in Figure 9.3.
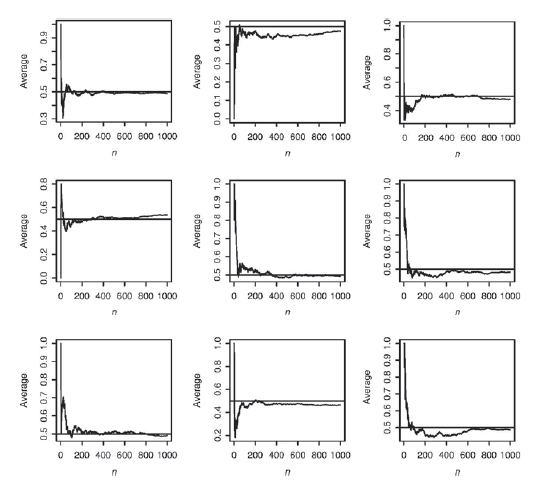
?Modify the code to illustrate the strong law of large numbers
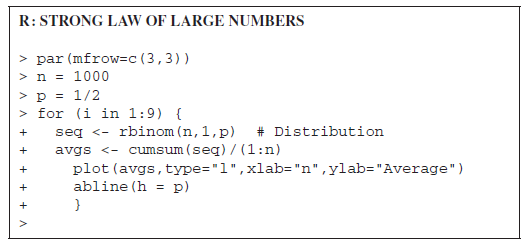
?for an i.i.d. sequence with the following distributions:?
(i) Pois(? = 5),?
(ii) Norm(?4, 4),?
(iii) Exp(? = 0.01).
O 200 400 600 800 1000 O 200 400 600 800 1000 200 400 600 800 1000 O 200 400 600 800 1000 O 200 400 600 800 1000 200 400 600 800 1000 O 200 400 600 800 1000 O 200 400 600 800 1000 O 200 400 600 a00 1000 ebeJony 0.5 0.6 0.7 0.8 0.9 1.0 Average ebeJeny 0.0 0.2 0.4 0.6 0.8 0.3 0.5 0.7 Average Average Average 0.2 0.4 0.6 0.8 1.0 O'L 60 BO 2'0 90 SO SO PO E'o zO L'O 00 abeiany ateiany ebeany O'L 6'0 8'0 L'0 9'0 g'0 9'0 O'L B'0 B0 L'0 9'0 9'O R: STRONG LAW OF LARGE NUMBERS par (mfrow=c (3,3)) > n = 1000 > p = 1/2 > for (i in 1:9) { seg
Step by Step Solution
3.31 Rating (157 Votes )
There are 3 Steps involved in it
To illustrate the strong law of large numbers ... View full answer

Get step-by-step solutions from verified subject matter experts