

Question: Using the failure rate data in Table 10.1, evaluate the reliability and mean time between failures for the high-pressure interlock in Fig. 10.4. Assume that
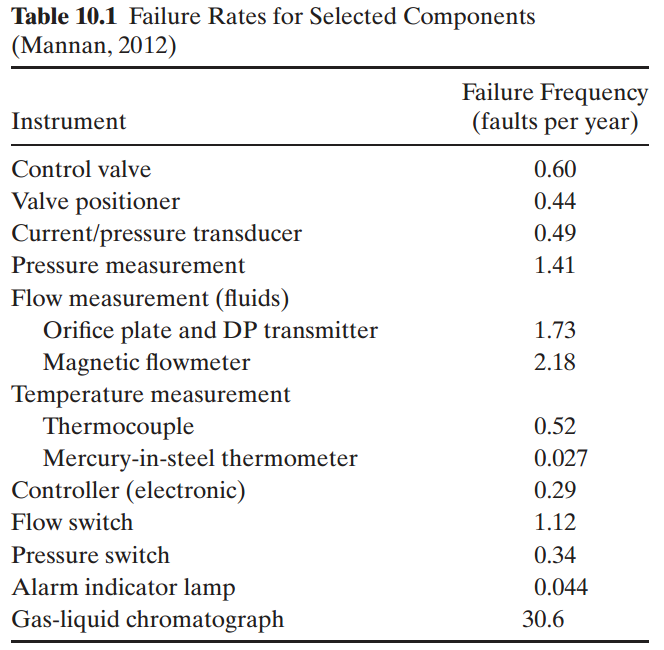
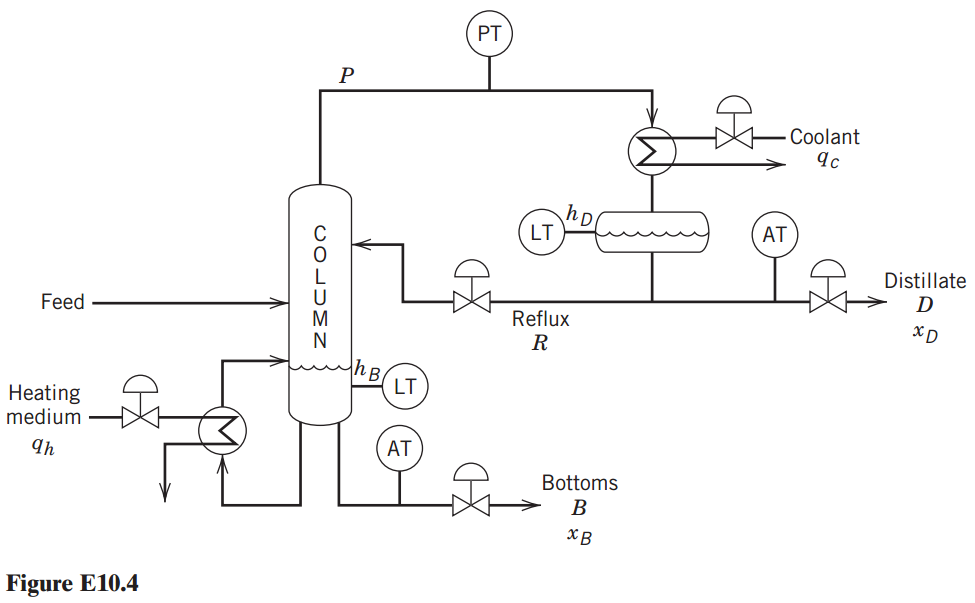
Table 10.1 Failure Rates for Selected Components (Mannan, 2012) Failure Frequency (faults per year) Instrument Control valve 0.60 Valve positioner Current/pressure transducer 0.44 0.49 Pressure measurement 1.41 Flow measurement (fluids) Orifice plate and DP transmitter Magnetic flowmeter Temperature measurement Thermocouple Mercury-in-steel thermometer Controller (electronic) 1.73 2.18 0.52 0.027 0.29 Flow switch 1.12 Pressure switch 0.34 Alarm indicator lamp 0.044 Gas-liquid chromatograph 30.6 PT Coolant hD LT AT Distillate D Feed Reflux R LT Heating medium h AT Bottoms Figure E10.4
Step by Step Solution
3.45 Rating (158 Votes )
There are 3 Steps involved in it
Assume that the switch and solenoid are independent From the failure rate data the fol... View full answer

Get step-by-step solutions from verified subject matter experts