

F.12 Refer to the data in Solved Problem F.1, on page 837, which deals with Higgins Plumbing
Question:
• F.12 Refer to the data in Solved Problem F.1, on page 837, which deals with Higgins Plumbing and Heating. Higgins has now collected 100 weeks of data and finds the following distribution for sales:
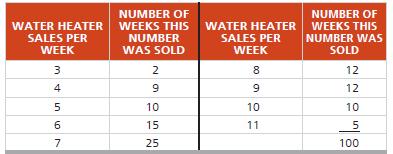
a) Assuming that Higgins maintains a constant supply of 8 heaters, simulate the number of stockouts incurred over a 20-week period (using the seventh column of Table F.4).
b) Conduct this 20-week simulation two more times and compare your answers with those in (a). Did they change significantly?
Why or why not?
c) What is the new expected number of sales per week?
Fantastic news! We've Found the answer you've been seeking!
Step by Step Answer:

Answered By
Mary Njunu
I posses Vast, diversified knowledge and excellent grammar as a result of working in ACADEMIC WRITING for more than 5 years. I deliver work in various disciplines with assurance of quality work. I purpose at meeting the clients’ expectations precisely. Let’s work together for the best and phenomenal grades.
929+ Reviews
2557+ Question Solved
Related Book For 

Operations Management: Sustainability And Supply Chain Management
ISBN: 9780135225899,9780135202722
13th Edition
Authors: Jay Heizer; Barry Render; Chuck Munson
Question Posted:
