1 . A sample of 200 students at a Big-Ten university was taken after the midterm to ask them whether they went bar hopping the
1 . A sample of 200 students at a Big-Ten university was taken after the midterm to ask them whether they went bar hopping the weekend before the midterm or spent the weekend studying and whether they did well or poorly on the midterm. The following table contains the result.
|
| Did Well in Midterm | Did Poorly in Midterm |
| Studying for Exam | 80 | 20 |
| Went Bar Hopping | 30 | 70 |
a) Referring to the table, of those who went bar hopping the weekend before the midterm in the sample, what percent of them did well on the midterm? (Show how you obtain your answer.)
b) Referring to the table, of those who did well on the midterm in the sample, what percent of them went bar hopping the weekend before the midterm? (Show how you obtain your answer.)
c) Referring to the table, what percent of the students in the sample went bar hopping the weekend before the midterm and did well on the midterm? (Show how you obtain your answer.)
d) Referring to the table, if the sample is a good representation of the population, we can expect what percent of the students in the population to spend the weekend studying and do poorly on the midterm? (Show how you obtain your answer.)
e) Referring to the table, if the sample is a good representation of the population, we can expect what percent of those who did poorly on the midterm to have spent the weekend studying? (Show how you obtain your answer.)
2. At a meeting of information systems officers for regional offices of a national company, a survey was taken to determine the number of employees the officers supervise in the operation of their departments, where X is the number of employees overseen by each information systems officer and f is the frequency.
X f
1 7
2 5
3 11
4 8
5 9
a) Referring to the table, how many regional offices are represented in the survey results? (Show how you obtain your answer.)
b) Referring to the table, across all of the regional offices, how many total employees were supervised by those surveyed? (Show how you obtain your answer.)
3. The following are the durations in minutes of a sample of long-distance phone calls made within the continental United States reported by one long-distance carrier.
Relative
Time (in Minutes) Frequency
0 but less than 5 0.37
5 but less than 10 0.22
10 but less than 15 0.15
15 but less than 20 0.10
20 but less than 25 0.07
25 but less than 30 0.07
30 or more 0.02
a) Referring to the table, if 1,000 calls were randomly sampled, how many calls lasted under 10 minutes? (Show how you obtain your answer.)
b) Referring to the table, if 100 calls were randomly sampled, how many calls lasted 15 minutes or longer? (Show how you obtain your answer.)
c) Referring to the table, what is the cumulative relative frequency for the percentage of calls that lasted under 20 minutes? (Show how you obtain your answer.)
d) Referring to the table, what is the cumulative relative frequency for the percentage of calls that lasted 10 minutes or more? (Show how you obtain your answer.)
e) Referring to the table, if 100 calls were sampled, ________ of them would have lasted less than 5 minutes or at least 30 minutes or more. (Show how you obtain your answer.)
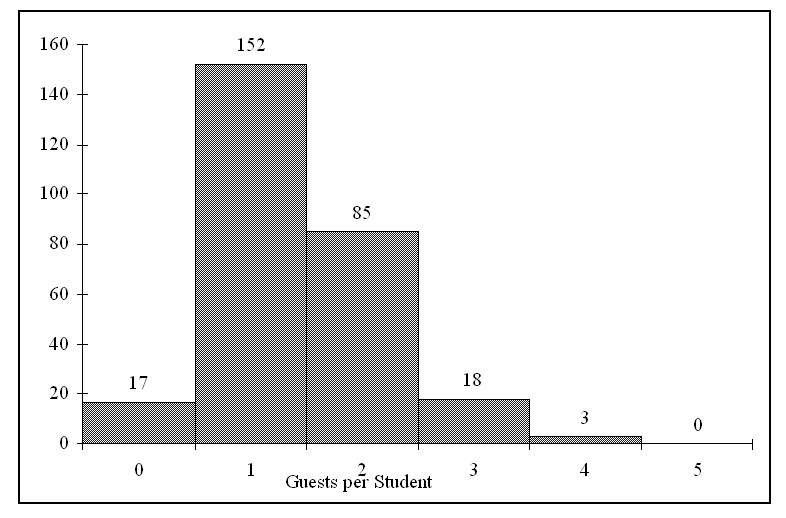
4. Every spring semester, the School of Business coordinates with local business leaders a luncheon for graduating seniors, their families, and friends. Corporate sponsorship pays for the lunches of each of the seniors, but students have to purchase tickets to cover the cost of lunches served to guests they bring with them. The following histogram represents the attendance at the senior luncheon, where X is the number of guests each graduating senior invited to the luncheon and f is the number of graduating seniors in each category.

a) Referring to the histogram, how many graduating seniors attended the luncheon? (Show how you obtain your answer.)
b) Referring to the histogram, if all the tickets purchased were used, how many guests attended the luncheon? (Show how you obtain your answer.)
160 140 120 100 80 60 40 20 0 17 0 152 1 85 Guests per Student 18 3 3 4 0 5
Step by Step Solution
3.37 Rating (166 Votes )
There are 3 Steps involved in it
Step: 1
1 a Student survey Did well test Did poorly test Row total Studied for ...
See step-by-step solutions with expert insights and AI powered tools for academic success
Step: 2

Step: 3

Document Format ( 2 attachments)
6097cf498a2f5_28195.pdf
180 KBs PDF File
6097cf498a2f5_28195.docx
120 KBs Word File
Ace Your Homework with AI
Get the answers you need in no time with our AI-driven, step-by-step assistance
Get Started


