Question
A Proctor and Gamble factory process fills boxes with detergent. Construct an appropriate set of control charts to monitor the process. Historical data for fill
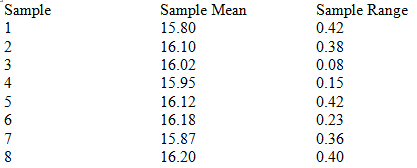
A Proctor and Gamble factory process fills boxes with detergent. Construct an appropriate set of control charts to monitor the process. Historical data for fill weight (in ounces) of eight samples is presented below. A sample size of six was used.

Identify the chart that is also known as fraction nonconforming or fraction defective chart.
| a. | A c-chart |
| b. | A p-chart |
Sample 1 234 5 6 7 8 Sample Mean 15.80 16.10 16.02 15.95 16.12 16.18 15.87 16.20 Sample Range 0.42 0.38 0.08 0.15 0.42 0.23 0.36 0.40
Step by Step Solution
3.34 Rating (151 Votes )
There are 3 Steps involved in it
Step: 1
a An Xbar anad Rchar...
Get Instant Access to Expert-Tailored Solutions
See step-by-step solutions with expert insights and AI powered tools for academic success
Step: 2

Step: 3

Ace Your Homework with AI
Get the answers you need in no time with our AI-driven, step-by-step assistance
Get StartedRecommended Textbook for
Statistics For Business And Economics
Authors: James T. McClave, P. George Benson, Terry T Sincich
12th Edition
032182623X, 978-0134189888, 134189884, 978-0321826237
Students also viewed these Mathematics questions
Question
Answered: 1 week ago
Question
Answered: 1 week ago
Question
Answered: 1 week ago
Question
Answered: 1 week ago
Question
Answered: 1 week ago
Question
Answered: 1 week ago
Question
Answered: 1 week ago
Question
Answered: 1 week ago
Question
Answered: 1 week ago
Question
Answered: 1 week ago
Question
Answered: 1 week ago
Question
Answered: 1 week ago
Question
Answered: 1 week ago
Question
Answered: 1 week ago
Question
Answered: 1 week ago
Question
Answered: 1 week ago
Question
Answered: 1 week ago
Question
Answered: 1 week ago
Question
Answered: 1 week ago
Question
Answered: 1 week ago
Question
Answered: 1 week ago
Question
Answered: 1 week ago
View Answer in SolutionInn App


