Question
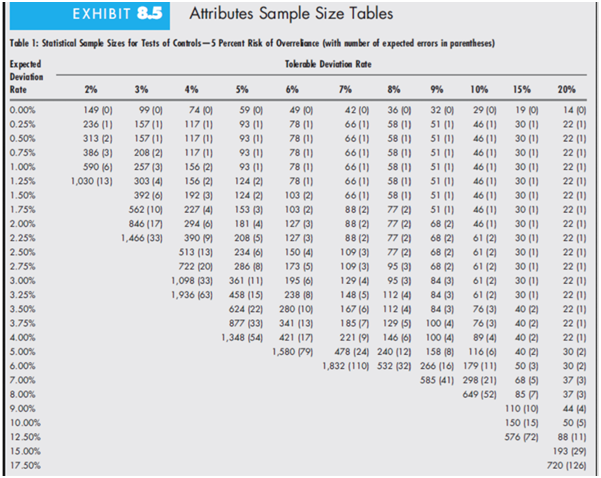
Carefully consider the meaning and importance of risk of overreliance, the tolerable rate of deviation, and the expected population deviation rate. Observe that Exhibit 8.5
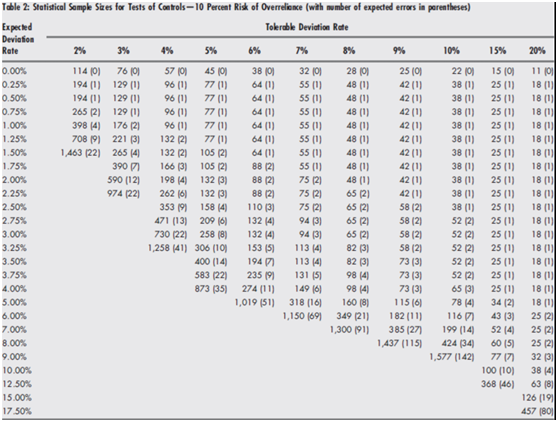
Carefully consider the meaning and importance of risk of overreliance, the tolerable rate of deviation, and the expected population deviation rate. Observe that Exhibit 8.5 Table 1 is used if the risk of overreliance is 5% and Exhibit 8.5 Table 2 is used if the risk of overreliance is 10%. Also notice that the term ?expected population deviation rate? implies that the audit is aware that there are deviations in the population. This awareness likely is based on past experience and present conditions within the entity being audited. In the sample size column of both exhibit tables the number in parenthesis is the expected number of errors from the corresponding data. That number is simply sample size times expected population deviation rate.
The partially completed table below includes information about risk of over reliance, the tolerable rate of deviation, and the expected population deviation rate. Referring to Exhibit 8.5 Table 1 or Table 2 as appropriate, and enter the sample size indicated for each item.


Risk Of Overreliance Tolerable Rate of Deviation Expected Population Deviation Rate Sampling Size
| Risk Of Overreliance Size | Tolerable Rate of Deviation | Expected Population Deviation Rate | Sampling |
| 5% | 2% | 1% | ? |
| 5% | 6% | 5% | ? |
| 5% | 10% | 8% | ? |
| 5% | 2% | 1% | ? |
| 5% | 6% | 5% | ? |
| 10% | 10% | 8% | ? |
| 10% |
|
|
|
EXHIBIT 8.5 Attributes Sample Size Tables Table 1: Statistical Sample Sizes for Tests of Controls-5 Percent Risk of Overreliance (with number of expected errors in parentheses) Expected Tolerable Deviation Rate Deviation Rate 0.00% 0.25% 0.50% 0.75% 1.00% 1.25% 1.50% 1.75% 2.00% 2.25% 2.50% 2.75% 3.00% 3.25% 3.50% 3.75% 4.00% 5.00% 6.00% 7.00% 8.00% 9.00% 10.00% 12.50% 15.00% 17.50% 2% 149 (0) 236 (1) 313 (2) 386 (3) 590 (6) 1,030 (13) 3% 99 (0) 157 (1) 157 (1) 208 (2) 257 (3) 303 (4) 392 (6) 562 (10) 846 (17) 1,466 (33) 4% 74 (0) 117 (1) 117 (1) 117 (1) 156 (2) 156 (2) 192 (3) 227 (4) 294 (6) 390 (9) 513 (13) 722 (20) 1,098 (33) 1,936 (63) 5% 59 (0) 93 (1) 93 (1) 93 (1) 93 (1) 124 (2) 124 (2) 153 (3) 181 (4) 208 (5) 234 (6) 286 (8) 361 (11) 458 (15) 624 (22) 877 (33) 1,348 (54) 6% 49 (0) 78 (1) 78 (1) 78 (1) 78 (1) 78 (1) 103 (2) 103 (2) 127 (3) 127 (3) 150 (4) 173 (5) 195 (6) 238 (8) 280 (10) 341 (13) 421 (17) 1,580 (79) 7% 42 (0) 66 (1) 66 (1) 66 (1) 66 (1) 66 (1) 66 (1) 88 (2) 88 (2) 88 (2) 109 (3) 109 (3) 129 (4) 148 (5) 167 (6) 185 (7) 221 (9) 8% 36 (0) 58 (1) 58 (1) 58 (1) 58 (1) 58 (1) 58 (1) 77 (2) 77 (21 77 (2) 77 (2) 95 (3) 95 (3) 112 (4) 112 (4) 129 (5) 146 (6) 478 (24) 240 (12) 1,832 (110) 532 (32) 9% 32 (0) 51 (1) 51 (1) 51 (1) 51 (1) 51 (1) 51 (1) 51 (1) 68 (2) 68 (2) 68 (2) 68 (2) 84 (3) 84 (3) 84 (3) 100 (4) 100 (4) 158 (8) 266 (16) 585 (41) 10% 29 (0) 46 (1) 46 (1) 46 (1) 46 (1) 46 (1) 46 (1) 46 (1) 46 (1) 61 (2) 61 (2) 61 (2) 61 (2) 61 (2) 76 (3) 76 (3) 89 (4) 116 (6) 179 (11) 298 (21) 649 (52) 15% 19 (0) 30 (1) 30 (1) 30 (1) 30 (1) 30 (1) 30 (1) 30 (1) 30 (1) 30 (1) 30 (1) 30 (1) 30 (1) 30 (1) 40 (2) 40 (2) 40 (2) 40 (2) 50 (3) 68 (5) 857 110 (10) 150 (15) 576 (72) 20% 14 (0) 22 (1) 22 (1) 22 (1) 22 (1) 22 (1) 22 (1) 22 (1) 22 (1) 22 (1) 22 (1) 22 (1) 22 (1) 22 (1) 22 (1) 22 (1) 22 (1) 30 (2) 30 (2) 37 (3) 37 (3) 44 (4) 50 (5) 88 (11) 193 (29) 720 (126) Table 2: Statistical Sample Sizes for Tests of Controls-10 Percent Risk of Overreliance (with number of expected errors in parentheses) Tolerable Deviation Rate Expected Deviation Rate 0.00% 0.25% 0.50% 0.75% 1.00% 1.25% 1.50% 1.75% 2.00% 2.25% 2.50% 2.75% 3.00% 3.25% 3.50% 3.75% 4.00% 5.00% 6.00% 7.00% 8.00% 9.00% 10.00% 12.50% 15.00% 17.50% 2% 114 (0) 194 (1) 194 (1) 265 (2) 398 (4) 708 (9) 1,463 (22) 3% 76 (0) 129 (1) 129 (1) 129 (1) 176 (2) 221 (3) 265 (4) 390 590 (12) 974 (22) 57 (0) 96 (1) 96 (1) 96 (1) 96 (1) 132 (2) 132 (2) 166 (3) 198 (4) 262 (6) 353 (9) 471 (13) 730 (22) 1,258 (41) 5% 45 (0) 77 (1) 77 (1) 77 (1) 77 (1) 77 (1) 105 (2) 105 (2) 132 (3) 132 (3) 158 (4) 209 (6) 258 (8) 306 (10) 400 (14) 583 (22) 873 (35) 38 (0) 64 (1) 64 (1) 64 (1) 64 (1) 64 (1) 64 (1) 88 (2) 88 (2) 88 (2) 110 (3) 132 (4) 132 (4) 153 (5) 194 235 (9) 274 (11) 1,019 (51) 7% 32 (0) 55 (1) 55 (1) 55 (1) 55 (1) 55 (1) 55 (1) 55 (1) 75 (2) 75 (2) 75 (2) 94 (3) 94 (3) 113 (4) 113 (4) 131 (5) 149 (6) 318 (16) 1,150 (69) 8% 28 (0) 48 (1) 48 (1) 48 (1) 48 (1) 48 (1) 48 (1) 48 (1) 48 (1) 65 (2) 65 (2) 65 (2) 65 82 (3) 82 (3) (2) 98 (4) 98 (4) 160 (8) 349 (21) 1,300 (91) 9% 25 (0) 42 (1) 42 (1) 42 (1) 42 (1) 42 (1) 42 (1) 42 (1) 42 (1) 42 (1) 58 (2) 58 (2) 58 (2) 58 (2) 73 (3) 73 (3) 73 (3) 115 (6) 182 (11) 385 (27) 1,437 (115) 10% 22 (0) 38 (1) 38 (1) 38 (1) 38 (1) 38 (1) 38 (1) 38 (1) 38 (1) 38 (1) 38 (1) 52 (2) 52 (2) 52 (2) 52 (2) 52 (2) 65 (3) 78 (4) 116 199 (14) 424 (34) 1,577 (142) 15% 15 (0) 25 (1) 25 (1) 25 (1) 25 (1) 25 (1) 25 (1) 25 (1) 25 (1) 25 (1) 25 (1) 25 (1) 25 (1) 25 (1) 25 (1) 25 (1) 25 (1) 34 (2) 43 (3) 52 (4) 60 (5) 77 (7) 100 (10) 368 (46) 20% 11 (0) 18 (1) 18 (1) 18 (1) 18 (1) 18 (1) 18 (1) 18 (1) 18 (1) 18 (1) 18 (1) 18 (1) 18 (1) 18 (1) 18 (1) 18 (1) 18 (1) 18 (1) 25 (2) 25 (2) 25 (2) 32 (3) 38 (4) 63 (8) 126 (19) 457 (80)
Step by Step Solution
3.49 Rating (162 Votes )
There are 3 Steps involved in it
Step: 1
Risk Of Overreliance Size Tolera...
Get Instant Access to Expert-Tailored Solutions
See step-by-step solutions with expert insights and AI powered tools for academic success
Step: 2

Step: 3

Document Format ( 2 attachments)
60916d6ea9fc7_22356.pdf
180 KBs PDF File
60916d6ea9fc7_22356.docx
120 KBs Word File
Ace Your Homework with AI
Get the answers you need in no time with our AI-driven, step-by-step assistance
Get Started


