Question
Consider total cost and total revenue, given in the following table: In the final column, enter profit for each quantity. ( Note : If the
Consider total cost and total revenue, given in the following table:
In the final column, enter profit for each quantity. ( Note : If the firm suffers a loss, enter a negative number in the appropriate cell.)
| Quantity | Total Cost | Marginal Cost | Total Revenue | Marginal Revenue | Profit |
|
| (Dollars) | (Dollars) | (Dollars) | (Dollars) | (Dollars) |
| |
| 0 | 6 | 0 |
| |||
| 1 | 8 | 7 | ||||
| 2 | 10 | 14 | ||||
| 3 | 13 | 21 | ||||
| 4 | 17 | 28 | ||||
| 5 | 24 | 35 | ||||
| 6 | 32 | 42 | ||||
| 7 | 42 | 49 | ||||
|
|
In order to maximize profit, how many units should the firm produce? Check all that apply.
3
4
5
6
In the previous table, enter marginal revenue and marginal cost for each quantity.
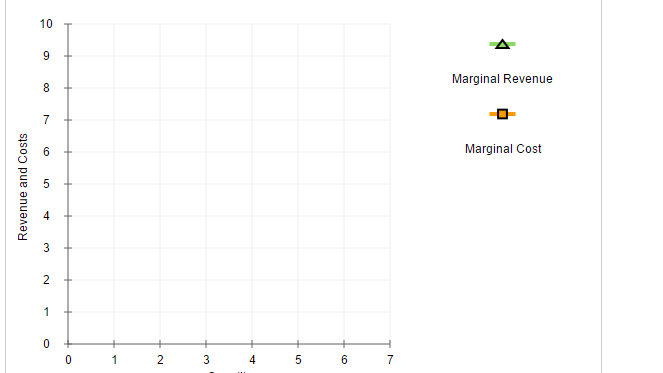
On the following graph, use the green points (triangle symbol) to graph the marginal-revenue curve, then use the orange points (square symbol) to plot the marginal-cost curve. ( Note : Be sure to plot from left to right and to plot between integers. For example, if the marginal cost of increasing production from 1 unit to 2 units is $5, then you would plot a point at (1.5, 5).)

The marginal-revenue curve and the marginal-cost curve cross at a quantity ( IS 4, <4, >4, IS 5, or BETWEEN 5 & 6 ) .
This firm ( IS NOT or IS ) in a competitive industry, because marginal revenue is ( INCREASING, DECREASING, or CONSTANT ) as quantity increases.
True or False: The industry is not in a long-run equilibrium.
True
False
Revenue and Costs 10 9 8 7 3 2 1 0 0 1 2 3 4 50 9 7 Marginal Revenue Marginal Cost
Step by Step Solution
3.38 Rating (154 Votes )
There are 3 Steps involved in it
Step: 1
Marginal revenue The total revenue can be calculated by using the equation n as follows Marginal rev...
Get Instant Access to Expert-Tailored Solutions
See step-by-step solutions with expert insights and AI powered tools for academic success
Step: 2

Step: 3

Ace Your Homework with AI
Get the answers you need in no time with our AI-driven, step-by-step assistance
Get Started


