Question
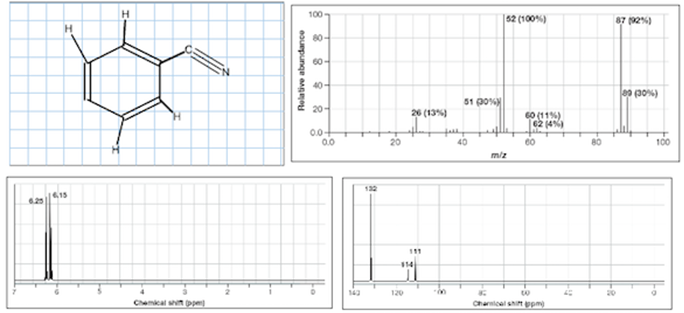
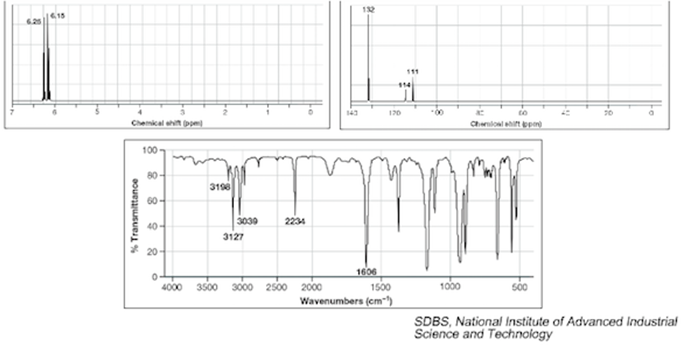
Draw the correct structure from the MS, 1H NMR, 13C NMR, and IR data given below. Both of the peaks on the 1H NMR spectrum
Draw the correct structure from the MS, 1H NMR, 13C NMR, and IR data given below. Both of the peaks on the 1H NMR spectrum are doublets (J = 2.5 Hz) and the integration ratio is 1:1.


9 6,15 H Relative abundance 100- --09 --09 40- 20- 0.0+ 0.0 142 132 20 26 (13%) $14 120 5100% fully 40 52 (100%) m/z 60 (11%) 62 (4%) 60 09 to Chanical shift ppm) 80 87 (92%) 00 (30%) 100 9 # Chemical shit (ppm) % Transmittance 100 80- 60- 40- 20 132 0 4000 3500 3000 2500 2000 170 111 114 3198 II m 3039 2234 3127 1606 1500 Wavenumbers (cm-) 1000 Chemical shift p 500 20 SDBS, National Institute of Advanced Industrial Science and Technology
Step by Step Solution
3.42 Rating (152 Votes )
There are 3 Steps involved in it
Step: 1
Here from the mass spectrum the peak at 87 and an M2 peak at 89 which is 1...
Get Instant Access to Expert-Tailored Solutions
See step-by-step solutions with expert insights and AI powered tools for academic success
Step: 2

Step: 3

Ace Your Homework with AI
Get the answers you need in no time with our AI-driven, step-by-step assistance
Get StartedRecommended Textbook for
Organic Chemistry
Authors: Graham Solomons, Craig Fryhle, Scott Snyder
11th edition
1118133579, 978-1118133576
Students also viewed these Chemistry questions
Question
Answered: 1 week ago
Question
Answered: 1 week ago
Question
Answered: 1 week ago
Question
Answered: 1 week ago
Question
Answered: 1 week ago
Question
Answered: 1 week ago
Question
Answered: 1 week ago
Question
Answered: 1 week ago
Question
Answered: 1 week ago
Question
Answered: 1 week ago
Question
Answered: 1 week ago
Question
Answered: 1 week ago
Question
Answered: 1 week ago
Question
Answered: 1 week ago
Question
Answered: 1 week ago
Question
Answered: 1 week ago
Question
Answered: 1 week ago
Question
Answered: 1 week ago
Question
Answered: 1 week ago
Question
Answered: 1 week ago
Question
Answered: 1 week ago
View Answer in SolutionInn App


