Question
Ride Gear Limited, based in Ontario, manufactures after-market accessories for motorcycles, such as fairings, hand guards, seats, and cargo carriers. In its early years of
Ride Gear Limited, based in Ontario, manufactures after-market accessories for motorcycles, such as fairings, hand guards, seats, and cargo carriers. In its early years of operation, Ride Gear had a reputation for outstanding product quality, which is a key determinant of success in this industry. Competition has become extremely intense in recent years, and Ride Gear has lost market share to companies based in China. In a recent survey of product quality conducted by a leading motorcycle magazine, Ride Gear slipped to fifth place among the top 10 accessory manufacturers.
In response to the disappointing results from the market survey, the president of Ride Gear, Dave Rankin, decided to take action in an effort to improve product quality. One of his first steps was to set up a quality improvement team to identify key areas where changes were most needed. Rankin remembered from his managerial accounting course in university that high quality of conformance is the overall objective and that different types of quality costs can interact to improve quality. However, beyond these basic details, Rankin?s recollection of quality costs was limited, so he appointed Gale Smith to lead the quality improvement team and make the changes needed to allow Ride Gear to better compete.
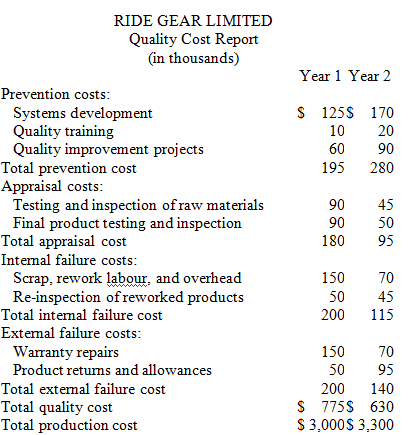
Smith?s quality improvement program has now been in operation for two years. The company?s most recent quality cost report is shown below:

Required:
1. Prepare percentage analysis of the company?s quality cost report with percentage figures in two ways: first, as a percentage of total production cost; and second, as a percentage of the total quality cost if Ride Gear?s quality improvement program has been successful.
2. Based on the analysis performed in (requirement 1) above, has Smith?s quality improvement program been successful to date?
RIDE GEAR LIMITED Quality Cost Report (in thousands) Prevention costs: Systems development Quality training Quality improvement projects Total prevention cost Appraisal costs: Testing and inspection of raw materials Final product testing and inspection Total appraisal cost Internal failure costs: Scrap, rework labour, and overhead Re-inspection of reworked products Total internal failure cost External failure costs: Warranty repairs Product returns and allowances Total external failure cost Total quality cost Total production cost Year 1 Year 2 $ 125$ 10 60 170 20 90 195 280 90 90 180 150 50 200 45 50 95 70 45 115 150 70 50 95 200 140 775S 630 $ $ 3,000$ 3,300
Step by Step Solution
3.45 Rating (155 Votes )
There are 3 Steps involved in it
Step: 1
1 year 1 year 2 A Prevention costs Amount Amount systems development 125 420 1610 170 ...
Get Instant Access to Expert-Tailored Solutions
See step-by-step solutions with expert insights and AI powered tools for academic success
Step: 2

Step: 3

Ace Your Homework with AI
Get the answers you need in no time with our AI-driven, step-by-step assistance
Get Started


