Suppose Sam runs a small business that manufactures shirts. Assume that the market for shirts is a competitive market, and the market price is $20
Suppose Sam runs a small business that manufactures shirts. Assume that the market for shirts is a competitive market, and the market price is $20 per shirt.
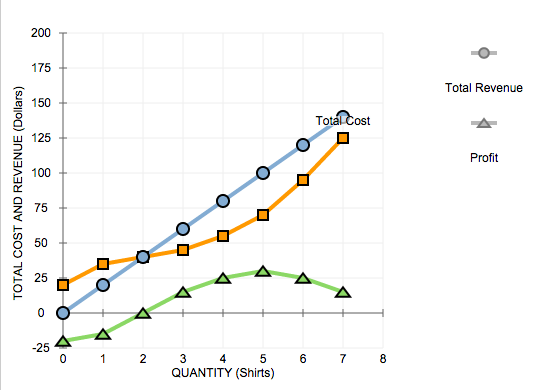
The following graph shows Sam's total cost curve.
Use the blue points (circle symbol) to plot total revenue and the green points (triangle symbol) to plot profit for the first seven shirts that Sam produces, including zero shirts.

Required:
Calculate Sam's marginal revenue and marginal cost for the first seven shirts he produces, and plot them on the following graph. Use the blue points (circle symbol) to plot marginal revenue and the orange points (square symbol) to plot marginal cost.
TOTAL COST AND REVENUE (Dollars) 200 175 150 125 100 75 -25 Oo A O D 0 1 2 DO O 4 O O A 5 3 QUANTITY (Shirts) O 0 Total Cost 0 6 7 8 Total Revenue Profit
Step by Step Solution
3.35 Rating (158 Votes )
There are 3 Steps involved in it
Step: 1
From the given total cost and price information the following table can be constructed Price is 20 a...
See step-by-step solutions with expert insights and AI powered tools for academic success
Step: 2

Step: 3

Document Format ( 2 attachments)
60942c39b4f91_24561.pdf
180 KBs PDF File
60942c39b4f91_24561.docx
120 KBs Word File
Ace Your Homework with AI
Get the answers you need in no time with our AI-driven, step-by-step assistance
Get Started


