Question
Tate last month, Jim Runnels, a sales representative for the Paint Tint Corporation, was called to the plant of Townhouse Paint Company, one of his
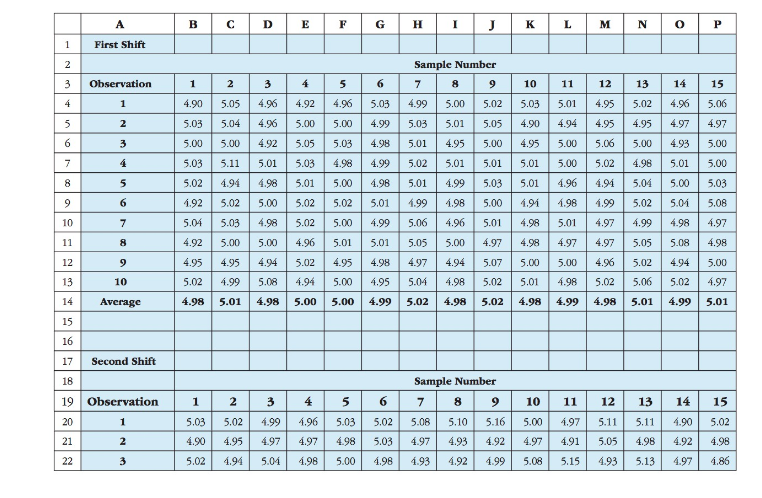
Tate last month, Jim Runnels, a sales representative for the Paint Tint Corporation, was called to the plant of Townhouse Paint Company, one of his largest accounts. The purchasing agent for Townhouse Paint was complaining that the tubes of paint tint it had received over the last couple of Weeks wen. Not within the specified range of 4.9 to 5.1 ounces. The off-weight tubes had not been detected by Townhouse's receiving clerks and had not been weighed or otherwise checked by their quality control staff. The problem arose when Townhouse began to use the tubes of tinting agent and found that the paint colors were not matching the specifications. The mixing charts used by the salespeople in Town-house's retail stores were based on 5-ounce tubes of tinting agent. Overfilled or underfilled tubes would result In improper paint mixes, and therefore in colors that did not meet cus-tomers' expectations. In consequence, Townhouse had to issue special instructions to all of its retail people that would allow them to compensate for the off-weight tubes. The Townhouse purchasing agent made it clear that a new supplier would be sought if this problem recurred. Paint Tint's qual-ity control department was immediately summoned to assist in determining the cause of the problem. Paint Tint's quality manager, Ronald Wilson, speculated that the cause of the problem was with the second shift. To analyze the problem, he entered into a spreadsheet the data from all the previous samples taken over the last two months. As it turned out, 15 random samples had been taken over the two-month period for both the first and the second shifts. Samples always consisted of 10 randomly selected tubes of paint tint. Also, separate sampling sched-ules were used for the first and second shifts so that the second shift would not automati-cally assume that it would be subject to a random sample just because the first shift had been earlier in the day. After entering the sample weight data of the tubes into the following spreadsheet and cal-culating the sample means, Ronald was quite puzzled. There did not seem to be any notice-able difference in the average weights across the two shifts. Furthermore, although the lines were running at less than full capacity during the first six samples, there still did not seem to be any change in either line after reaching full production.


Required:
Can you identify any difference between the first and second shifts that explains the weight problem? If so, when is this difference first detectable?
1 2 3 4 5 6 7 8 9 10 11 12 13 14 15 16 17 18 19 20 21 22 A First Shift Observation 1 2 3 4 5 6 7 8 9 10 Average Second Shift Observation 1 2 3 B D E 3 4.96 4.96 4 4.92 5.00 G 1 2 5 6 4.90 5.05 4.96 5.03 5.03 5.04 5.00 4.99 5.00 5.00 4.92 5.05 5.03 4.98 5.03 5.11 5.01 5.03 4.98 4.99 5.02 4.94 4.98 1.92 5.00 5.02 5.01 5.00 4.98 5.01 1.99 4.99 5.06 5.02 5.03 4.98 5.02 5.00 5.02 5.04 4.92 5.00 5.00 4.96 5.01 5.01 5.05 4.95 4.95 4.94 5.02 4.95 4.98 4.97 5.02 4.99 5.08 4.94 5.00 4.95 5.04 4.98 5.01 4.98 5.00 5.00 4.99 5.02 1 2 3 4 5.03 5.02 4.99 4.96 4.90 4.95 4.97 4.97 5.02 4.94 5.04 4.98 H 5 6 5.03 5.02 4.98 5.03 5.00 4.98 Sample Number 7 4.99 5.03 K 8 9 10 5.00 5.02 5.03 4.90 5.01 5.05 4.95 5.00 4.95 5.01 5.02 5.01 5.01 4.99 L 11 12 13 14 15 5.01 4.95 5.02 4.96 5.06 4.95 4.95 4.97 4.97 4.94 5.00 5.06 5.00 4.93 5.00 5.01 5.00 5.01 5.01 5.00 5.02 4.98 5.03 5.01 4.96 4.94 5.00 4.91 1.98 1.99 5.00 5.03 5.04 5.02 5.01 5.08 5.01 4.98 5.01 4.97 4.99 4.98 4.97 4.97 4.98 4.97 4.97 5.05 5.08 4.98 4.98 4.96 5.00 4.94 4.98 5.02 5.01 4.98 5.02 4.98 5.02 4.98 4.99 4.98 5.07 5.00 5.00 4.96 5.02 4.94 5.00 5.06 5.02 4.97 5.01 4.99 5.01 Sample Number 7 8 9 5.08 5.10 5.16 5.00 4.97 4.93 4.92 4.97 4.93 4.92 4.99 5.08 M N 10 11 0 12 13 14 5.11 4.90 4.98 4.92 4.97 4.97 5.11 4.91 5.05 5.15 4.93 5.13 P 15 5.02 4.98 4.86 23 24 25 26 27 28 29 30 A4 5 6 7 8 9 10 Average B D E F 4.98 5.05 5.02 5.00 4.97 5.01 4.95 5.02 5.02 4.99 4.99 4.99 5.03 5.00 5.04 4.95 4.96 4.99 1.99 1.97 5.00 1.98 1.99 1.99 1.93 1.86 5.01 5.00 5.00 4.96 4.98 4.99 5.08 5.07 5.02 5.01 5.00 5.05 5.02 5.03 4.97 5.03 5.00 4.98 4.97 4.82 4.96 4.93 4.99 4.95 4.99 5.05 5.14 5.03 4.99 4.99 5.00 5.00 5.00 5.01 4.96 4.99 5.01 G H I 4.84 4.93 5.06 4.98 5.04 5.07 5.03 4.98 4.94 4.91 4.96 J K 5.00 5.07 4.96 S 13 5.13 4.93 4.96 4.91 5.00 N O P 5.15 4.92 4.94 4.98 5.10 5.04 4.93 4.88 5.12 5.03 4.97 5.07 5.15 4.74 5.01 1.91 5.05 4.93 4.95 4.95 4.90 4.97 4.91 5.03 5.04 4.98 5.03 5.11 5.01 5.03 5.08 4.92 5.01 4.98 5.06 4.97 4.97 L Has M 5.15
Step by Step Solution
3.51 Rating (168 Votes )
There are 3 Steps involved in it
Step: 1
Consider the given data The difference in the averages ...
Get Instant Access to Expert-Tailored Solutions
See step-by-step solutions with expert insights and AI powered tools for academic success
Step: 2

Step: 3

Document Format ( 2 attachments)
6099dc93936f3_30102.pdf
180 KBs PDF File
6099dc93936f3_30102.docx
120 KBs Word File
Ace Your Homework with AI
Get the answers you need in no time with our AI-driven, step-by-step assistance
Get Started


