Question
The AB Charity is planning its annual campaign to raise money. This year, three alternative methods are being considered: (i) street collections, (ii) a television
The AB Charity is planning its annual campaign to raise money. This year, three alternative methods are being considered: (i) street collections, (ii) a television advertising campaign and (iii) a direct-mail appeal. After using simulation to assess the risk associated with the alternatives the charity?s managers have opted for a direct-mail appeal.
The direct-mail appeal will involve sending out 343 000 letters to selected people. To encourage donation these will include a free ballpoint pen displaying the charity?s logo and people not replying after three weeks will receive a reminder. While the fixed costs of the campaign and the cost of sending out each letter and reminder are known for certain, the charity?s managers have had to estimate probability distributions for the following four factors:
(a) The percentage of people who will reply to the first letter in the North (N), Central (C) and South (S) regions of the country, respectively.
(b) The average donation of those replying to the first letter in each of these regions.
(c) The percentage of people who will reply to the reminder in each of the three regions.
(d) The average donation of those replying to the reminder in each of the regions
Probability distributions have been estimated for the different regions because their different economic conditions are likely to have a major effect on people?s propensity to donate to the charity.
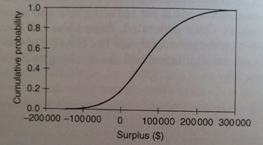
Figure 12.6 shows the cumulative probability distribution of net returns (i.e., the total value of donations less the cost of running the direct-mail appeal). It can be seen that there is approximately a 20% probability that the net returns will be negative, causing the charity to lose money. In the simulation the possible losses extended to nearly $150 000.
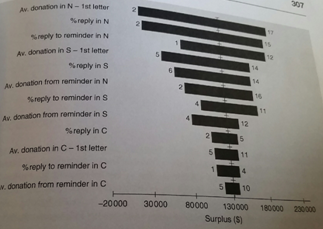
The managers of the charity are keen to take action to reduce this risk, but are not sure where their actions should be directed. Figure 12.7 shows a tornado diagram for the appeal. The numbers at the ends of the bars show what are thought to be the highest and lowest possible values for each factor. For example, the possible average donation in the North is thought to range from $2 to $17.
Figure 12.7 ? Tornado diagram for the AB Charity
Ad donation N 1st letter = 2-17
% Reply N = 2-15
% reply to reminder in N = 1-12
Adv donation S 1st letter = 5-14
% Reply S = 6 -14
Adv donation from reminder in N = 2-16
% reply to reminder in S = 4-11
Adv donation from reminder in S = 2-12
% Reply in C 2-5
Adv donation C 1st letter = 5-11
% reply to reminder in S = 5-10
Please show any work and formulas
(a) Identify the areas where risk management is likely to be most effective.
(b) Create a set of possible risk management strategies that might reduce the risk of the charity losing money and increase its expected return. (Goodwin 305-307)


Cumulative probability 1.0 0.8- 0.6- 0.4 0.2+ 0.0 -200000-100000 0 100000 200000 300000 Surplus (S) Av. donation in N-1st letter % reply in N %reply to reminder in N Av. donation in 8-1st letter % reply in S Av. donation from reminder in N %reply to reminder in S Av. donation from reminder in S % reply in C Av. donation in C-1st letter % reply to reminder in C w.donation from reminder in C -20000 30000 80000 12 11 5 10 130000 Surplus (S) 14 14 16 17 15 11 12 180000 307 230000
Step by Step Solution
3.42 Rating (152 Votes )
There are 3 Steps involved in it
Step: 1
The areas where risk management is likely to be most effective are as follows Organization structure ...
Get Instant Access to Expert-Tailored Solutions
See step-by-step solutions with expert insights and AI powered tools for academic success
Step: 2

Step: 3

Document Format ( 2 attachments)
609aec223c641_31130.pdf
180 KBs PDF File
609aec223c641_31130.docx
120 KBs Word File
Ace Your Homework with AI
Get the answers you need in no time with our AI-driven, step-by-step assistance
Get Started


