

Question: The following graph is a typical long- run average total cost curve. Long-Run Average Total Cost Curve: Economies of scale exist for quantities between (Click
The following graph is a typical long- run average total cost curve.
Long-Run Average Total Cost Curve:
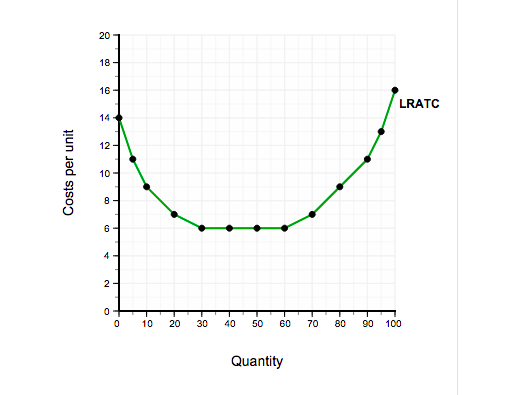
Economies of scale exist for quantities between (Click to select) 60-100 /0-30 /0-60 /30-60.
Constant returns to scale exist for quantities between (Click to select) 60-10030-1000-6030-60. Diseconomies of scale exist for quantities between (Click to select) 0-3030-10060-10030-60.
The minimum efficient level of production is (Click to select) 0604530.
a. Why does it slope downward initially? Diseconomies of scale/ Increasing marginal productivity/ Economies of scope/ Economies of scale. b. Why does it eventually slope upward? Diseconomies of scope/ Diseconomies of scale/ Increasing marginal productivity/ Economies of scale. c. How would your answers to a and b differ if you had drawn a short-run cost curve?
The average cost curve in the short run is also U-shaped. Its shape is due initially to decreasing marginal productivity and eventually increasing marginal productivity.
The average cost curve in the short run is also U-shaped. Its shape is due initially to economies of scope and eventually diseconomies of scope.
The average cost curve in the short run is also U-shaped. Its shape is due initially to increasing marginal productivity and eventually decreasing marginal productivity.
The average cost curve in the short run is also U-shaped. Its shape is due initially to economies of scale and eventually diseconomies of scale.
d. How large is the fixed-cost component of the long-run cost curve?
Fixed cost is always increasing in the long run, so it is a very large component.
There is no fixed-cost component in the long run.
Fixed cost is shown by the vertical distance between the maximum and minimum points on the long-run average total cost curve.
Fixed cost is equal to the minimum point on the long-run average total cost curve.
e. If there were constant returns to scale everywhere, what would the long-run cost curve look like?
The long-run cost curve would be (Click to select) downward-sloping/ horizontal/ upward-sloping.
per unit Costs 20 18- 16 14 12- 10- 8 CD 6 4 2- 0 0 10 20 30 40 50 60 Quantity 70 LRATC 80 90 100
Step by Step Solution
There are 3 Steps involved in it
Analysis Based on the shape of the LongRun Average Total Cost LRATC curve we can discuss the questions as follows 1 Economies of Scale This occurs whe... View full answer

Get step-by-step solutions from verified subject matter experts
Document Format (2 attachments)
6090d09c62727_21949.pdf
180 KBs PDF File
6090d09c62727_21949.docx
120 KBs Word File