Question
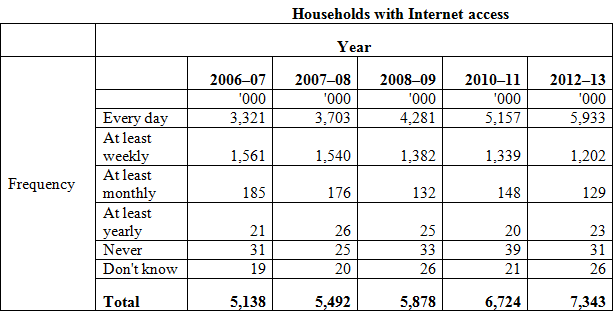
The table below is taken from the Australian Bureau of Statistics website. It provides data on household use of the Internet from 2006 to 2013
The table below is taken from the Australian Bureau of Statistics website. It provides data on household use of the Internet from 2006 to 2013 in Australia.

(a) Find the probability that a randomly selected households access the Internet in 2010-2011.
(b) In the years of 2006-2007, what is the probability that a randomly selected households use the Internet every day?
(c) What is the probability that a randomly selected households access the Internet at least monthly or at least yearly?
(d) What is the probability that a randomly selected households access the Internet at least on monthly basis in 2007-2008?
Frequency Every day At least weekly At least monthly At least yearly Never Don't know Total 2006-07 '000 3,321 1,561 185 21 31 19 5,138 Households with Internet access Year 2007-08 '000 3,703 1,540 176 26 25 20 5,492 2008-09 '000 4,281 1,382 132 25 33 26 5,878 2010-11 '000 5,157 1,339 148 20 39 21 6,724 2012-13 '000 5,933 1,202 129 23 31 26 7,343
Step by Step Solution
3.21 Rating (148 Votes )
There are 3 Steps involved in it
Step: 1
a The probability that a randomly selected household access ...
Get Instant Access to Expert-Tailored Solutions
See step-by-step solutions with expert insights and AI powered tools for academic success
Step: 2

Step: 3

Ace Your Homework with AI
Get the answers you need in no time with our AI-driven, step-by-step assistance
Get Started


