Answered step by step
Verified Expert Solution
Question
1 Approved Answer
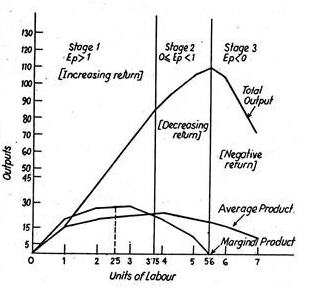
Using the following graph for substitutable inputs case, explain the Stolper-Samuelson theorem. T T 688 T Outputs IT 130 120 110 100 && 90 80
Using the following graph for substitutable inputs case, explain the Stolper-Samuelson theorem.

T T 688 T Outputs IT 130 120 110 100 && 90 80 70 60 30 T 15 5 I Stage 1 Ep>1 [Increasing return] Stage 2 0 < Ep
Step by Step Solution
★★★★★
3.49 Rating (162 Votes )
There are 3 Steps involved in it
Step: 1
The StopperSamuelson Theorem can be thought as a fundamental theorem in Huckster Ohlin trade ...
Get Instant Access to Expert-Tailored Solutions
See step-by-step solutions with expert insights and AI powered tools for academic success
Step: 2

Step: 3

Document Format ( 2 attachments)
609085055a9e8_21759.pdf
180 KBs PDF File
609085055a9e8_21759.docx
120 KBs Word File
Ace Your Homework with AI
Get the answers you need in no time with our AI-driven, step-by-step assistance
Get Started


