

Answered step by step
Verified Expert Solution
Question
1 Approved Answer
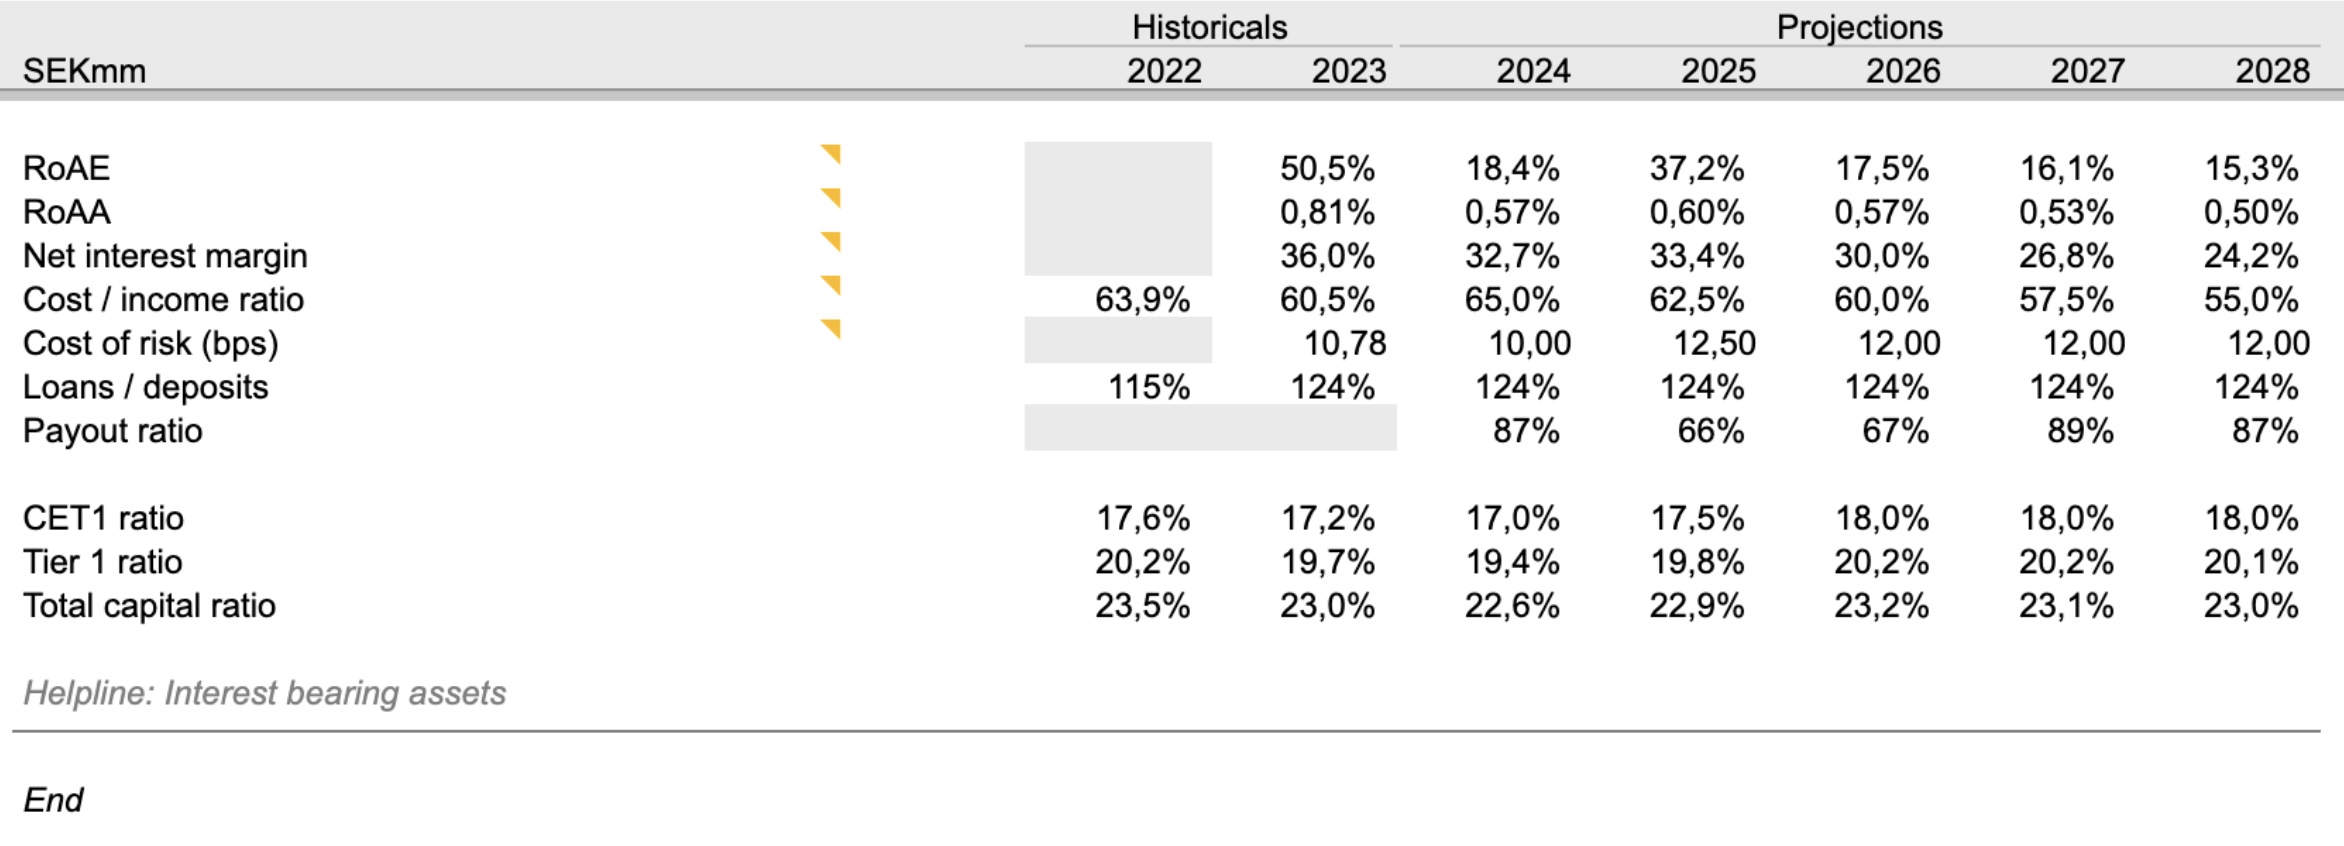
Historicals Projections SEKmm 2022 2023 2024 2025 2026 2027 2028 ROAE 50,5% 18,4% 37,2% 17,5% 16, 1% 15,3% ROAA 0,81% 0,57% 0,60% 0,57% 0,53% 0,50%
Step by Step Solution
There are 3 Steps involved in it
Step: 1

Get Instant Access to Expert-Tailored Solutions
See step-by-step solutions with expert insights and AI powered tools for academic success
Step: 2

Step: 3
Ace Your Homework with AI
Get the answers you need in no time with our AI-driven, step-by-step assistance
Get Started
International Financial Reporting Standards An Introduction
Authors: Belverd Needles, Marian Powers
2nd edition
053847680X, 978-1111793234, 1111793239, 978-0538476805