

Answered step by step
Verified Expert Solution
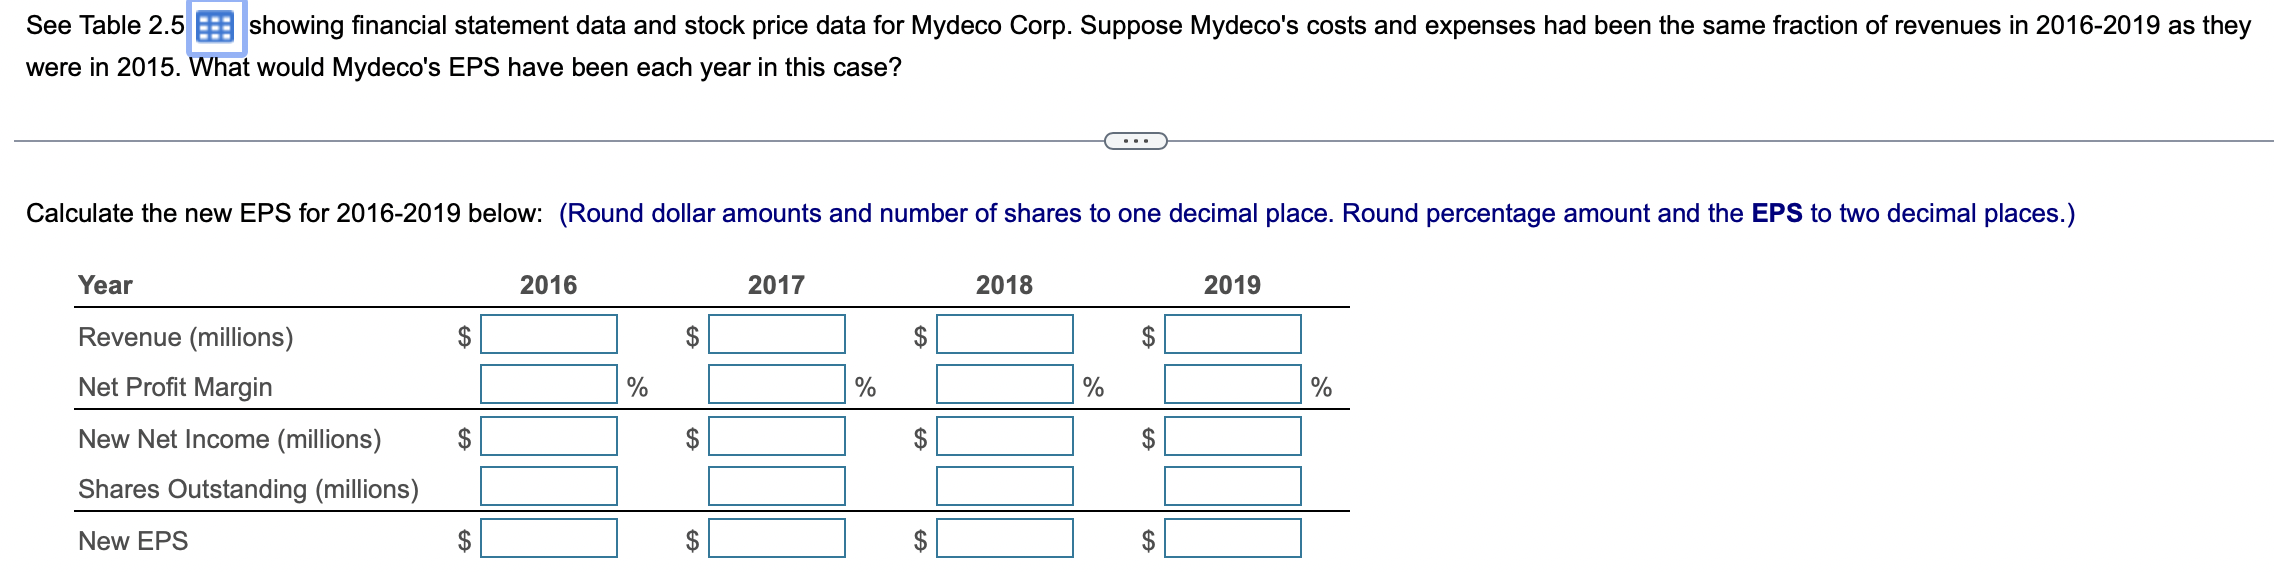
Question
1 Approved Answer
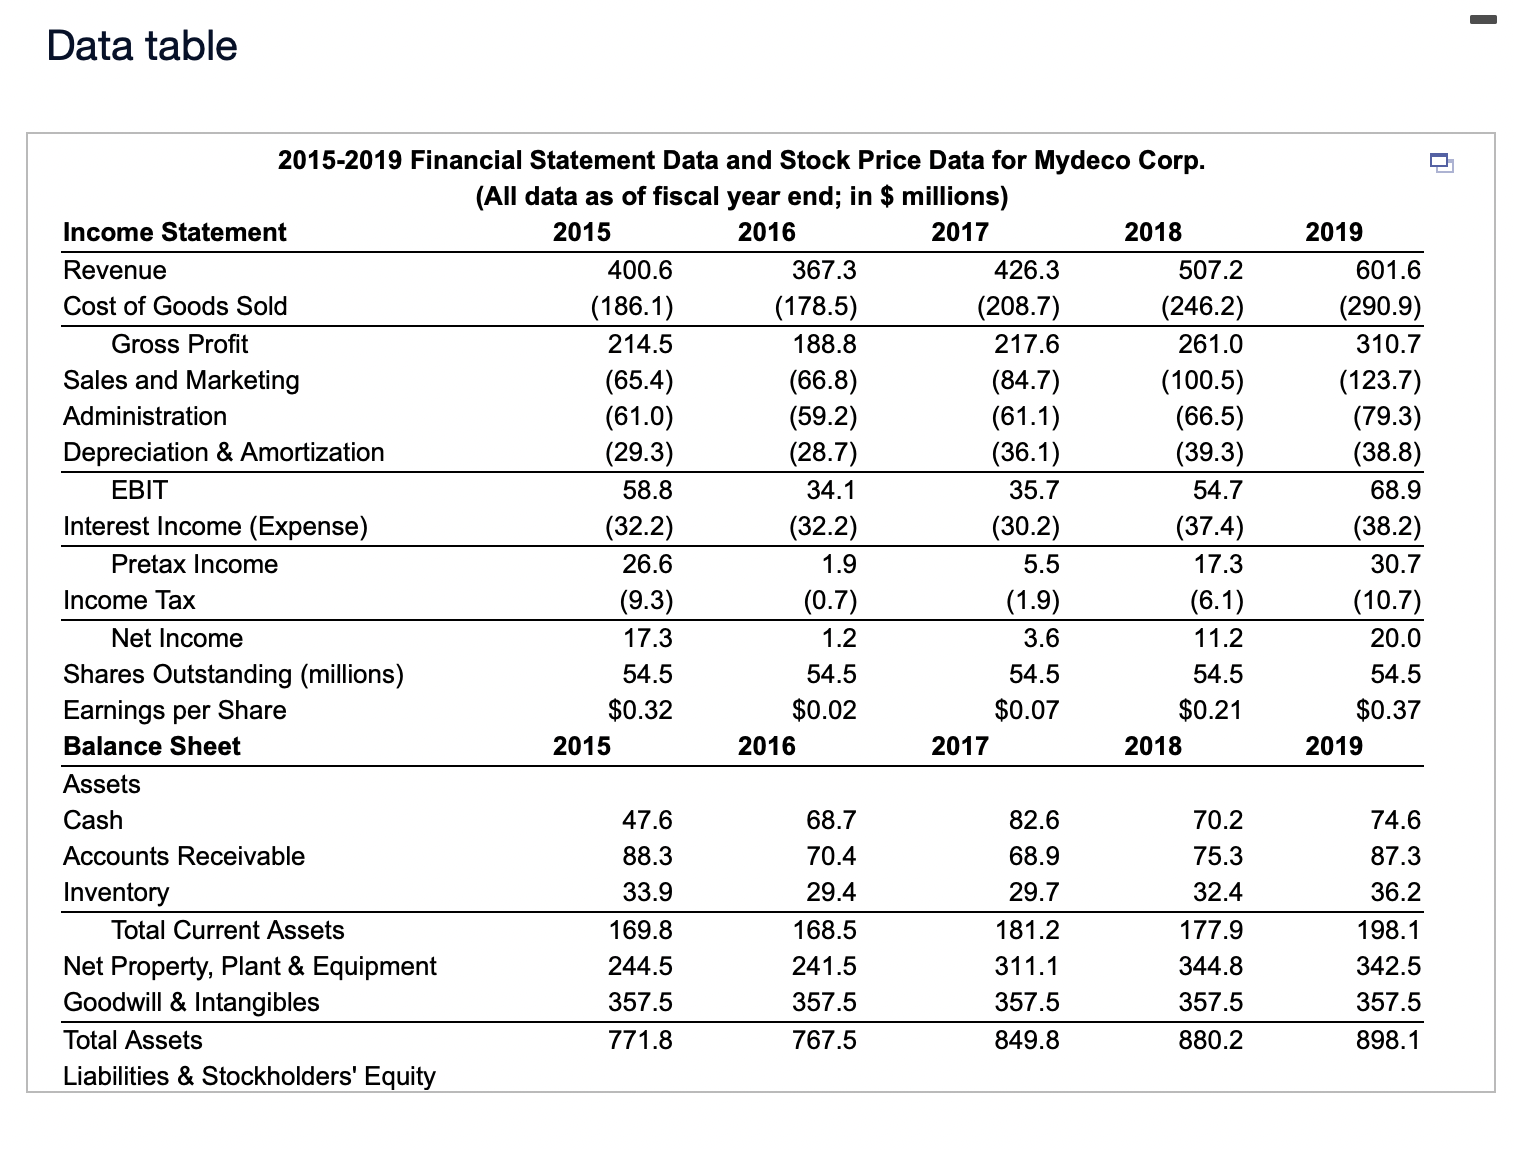
Data table 2015-2019 Financial Statement Data and Stock Price Data for Mydeco Corp. (All data as of fiscal year end; in $ millions) Income Statement
Step by Step Solution
There are 3 Steps involved in it
Step: 1

Get Instant Access to Expert-Tailored Solutions
See step-by-step solutions with expert insights and AI powered tools for academic success
Step: 2

Step: 3
Ace Your Homework with AI
Get the answers you need in no time with our AI-driven, step-by-step assistance
Get Started
Foundations of Financial Management
Authors: Stanley Block, Geoffrey Hirt, Bartley Danielsen
16th edition
125927716X, 978-1259687969, 1259687961, 978-1259277160