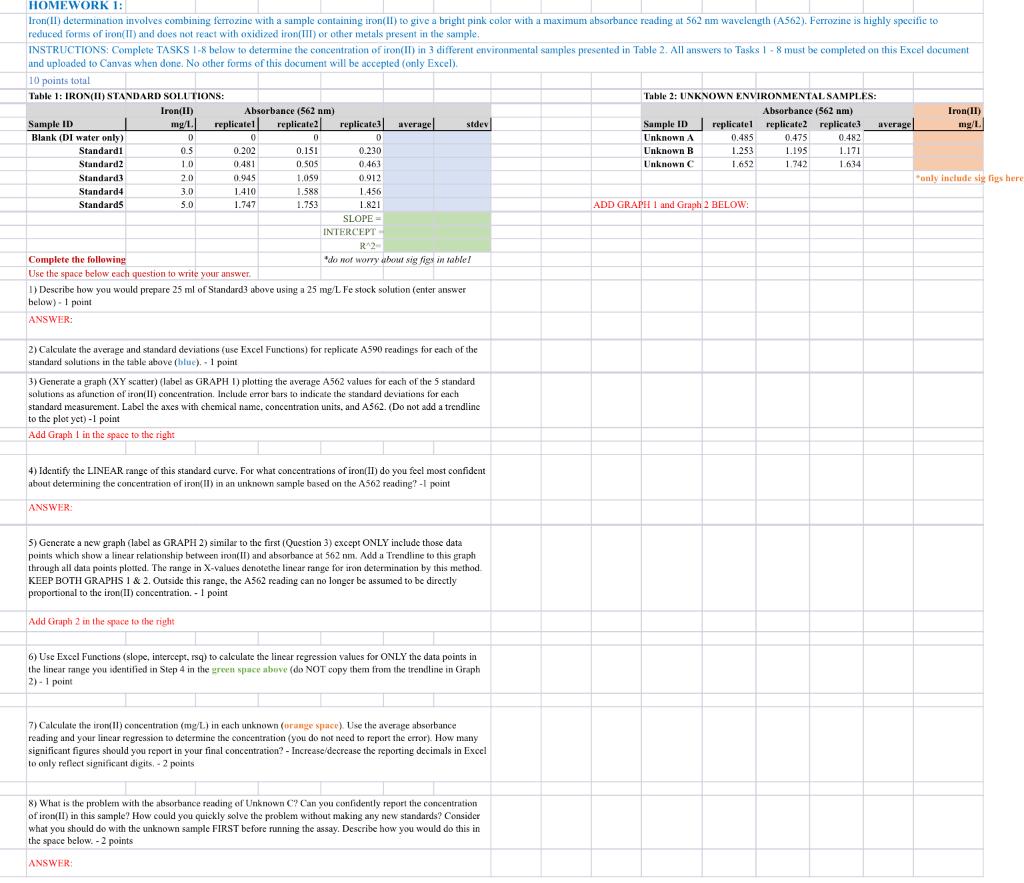
0 0 0 HOMEWORK 1: Iron(II) determination involves combining ferrozine with a sample containing iron(II) to give a bright pink color with a maximum absorbance reading at 562 nm wavelength (A562). Ferrozine is highly specific to reduced forms of iron(II) and does not react with oxidized iron(III) or other metals present in the sample, INSTRUCTIONS: Complete TASKS 1-8 below to determine the concentration of iron(IT) in 3 different environmental samples presented in Table 2. All answers to Tasks 1 - 8 must be completed on this Excel document and uploaded to Canvas when done. No other forms of this document will be accepted (only Excel). 10 points total Table 1: IRON(II) STANDARD SOLUTIONS: Table 2: UNKNOWN ENVIRONMENTAL SAMPLES: Iron(ID) Absorbance (562 nm) Absorbance (562 am) () Sample ID Iron(11) mg/1 | replicatel replicate2 replicate3 average stdev Sample ID replicatel replicate2 replicate3 average mg/l Blank (DI water only) 0 Unknown A 0.485 0.475 0.482 Standardi 0.202 0.151 0.230 Unknown B 1.253 1.195 1.171 Standard2 0.481 0.505 0.463 Unknown 1,652 1.742 1.634 Standard3 20 0045 1.059 0.912 only include sig lige here Standard 4 1.588 1.456 Standards 1.747 1.753 1.821 ADD GRAPH 1 and Graph 2 BELOW SLOPE INTERCEPT RA2 Complete the following do not worry about sig figs in table! Use the space below each question to write your answer 1) Describe how you would prepare 25 ml of Standard3 above using a 25 mg/L fe stock solution (enter answer below). 1 point ANSWER: 0 OS 10 3.0 1.410 5.0 2) Calculate the average and standard deviations (use Excel Functions) for replicate A590 readings for each of the standard solutions in the table above (blue). - 1 point 3) Generate a graph (XY scatter) (label as GRAPH D) plotting the average A562 values for each of the 5 standard solutions as a function of iron(II) concentration. Include error bars to indicate the standard deviations for each standard measurement. Label the axes with chemical name, concentration units, and AS62. (Do not add a trendline to the plot yet) -1 point Add Graph 1 in the space to the right 4) Identify the LINEAR range of this standard curve. For what concentrations of iron(II) do you feel most confident about determining the concentration of iron(II) in an unknown sample based on the A562 reading? - I print ANSWER a 5) Generate a new graph (label as GRAPH 2) similar to the first (Question 3) except ONLY include those data points which show a linear relationship between iron(II) and absorbance at 562 nm. Add a Trendline to this graph through all data points plotted. The range in X-values denotethe linear range for iron determination by this method KEEP BOTH GRAPHS 1 & 2. Outside this range, the A562 reading can no longer be assumed to be directly proportional to the iron(II) concentration. - 1 point Add Graph 2 in the space to the right 6) Use Excel Functions (slope, intercept, rsq) to calculate the linear regression values for ONLY the data points in the linear range you identified in Step 4 in the green space above (do NOT copy them from the trendline in Graph 2). 1 point 7) Calculate the only concentration (mg/L) in each unknown (orange space). Use the average absorbance reading and your linear regression to determine the concentration (you do not need to report the error). How many significant figures should you report in your final concentration? - Increase decrease the reporting decimals in Excel to only reflect significant digits. - 2 points 8) What is the problem with the absorbance reading of Unknown C? Can you confidently report the concentration of iron) in this sample? How could you quickly solve the problem without making any new standards? Consider what you should do with the unknown sample FIRST before running the assay. Describe how you would do this in the space below. - 2 points