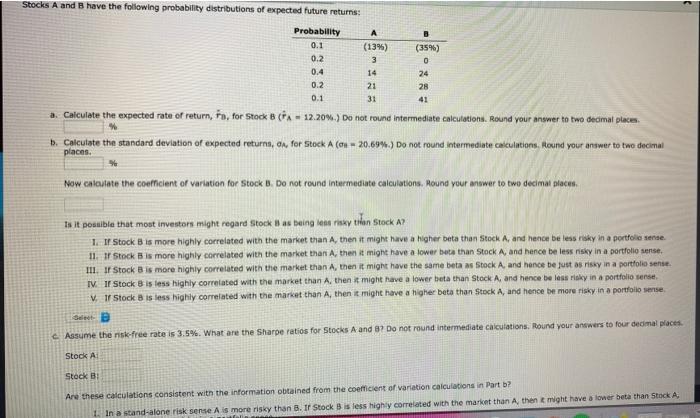
0 24 Stocks A and B have the following probability distributions of expected future returns Probability 0.1 (13%) (35%) 0.2 3 0.4 14 0.2 21 28 0.1 31 a. Calculate the expected rate of return, to, for Stock B (A - 12.202.) Do not found intermediate calculations. Round your answer to two decimal places 1. Calculate the standard deviation of expected returns, an for Stock A (ou - 20.69%) Do not round Intermediate calculations, Hound your answer to two decimal places. 41 Now cutestate the coefficient of variation for Stock B. Do not round intermediate calculations. Hound your answer to two decimal places Is it possible that most investors might regard stock as being less risky tilan Stock A? 1. If Stock B is more highly correlated with the market than A, then it might have a higher beta than Stock A, and hence be less risky in a portfolio sense. 11. Ir stock is more highly correlated with the market than A, then it might have a lower beta than Stock A, and hence be less risky in a portfolio sense. III. I Stock B is more highly correlated with the market than A, then it might have the same betaas Stock A, and hence be just as risky in a portfolio sense. TV. If Stock B is less highly correlated with the market than A, then it might have a lower beta than Stock A, and hence be less risky in a portfolio sense v. 1 Stock B is less highly correlated with the market than A then it might have a higher beta than Stock A, and hence be more risky in a portfolio sense SB Assume the risk free rate is 3.5%. What are the Sharpe ratios for Stocks A and B? Do not round Intermediate calculations. Round your answers to four decimal places Stock A Stock B Are these calculations consistent with the information obtained from the coefficient of variation calculations in Part b? 1. In a stand-alone risk sense A is more risky than B. Ir Stock B is less highly correlated with the market than A then t might have a lower beta than Stock