Answered step by step
Verified Expert Solution
Question
1 Approved Answer
000000000000n0000000+0m0000000 i fx 2.4LCD Touch screen, 8GB flash memorv, plays music, video, photos and text, share IPEG, EMP, GIf, Tiff Iuctio Productlabel ProductName File Home
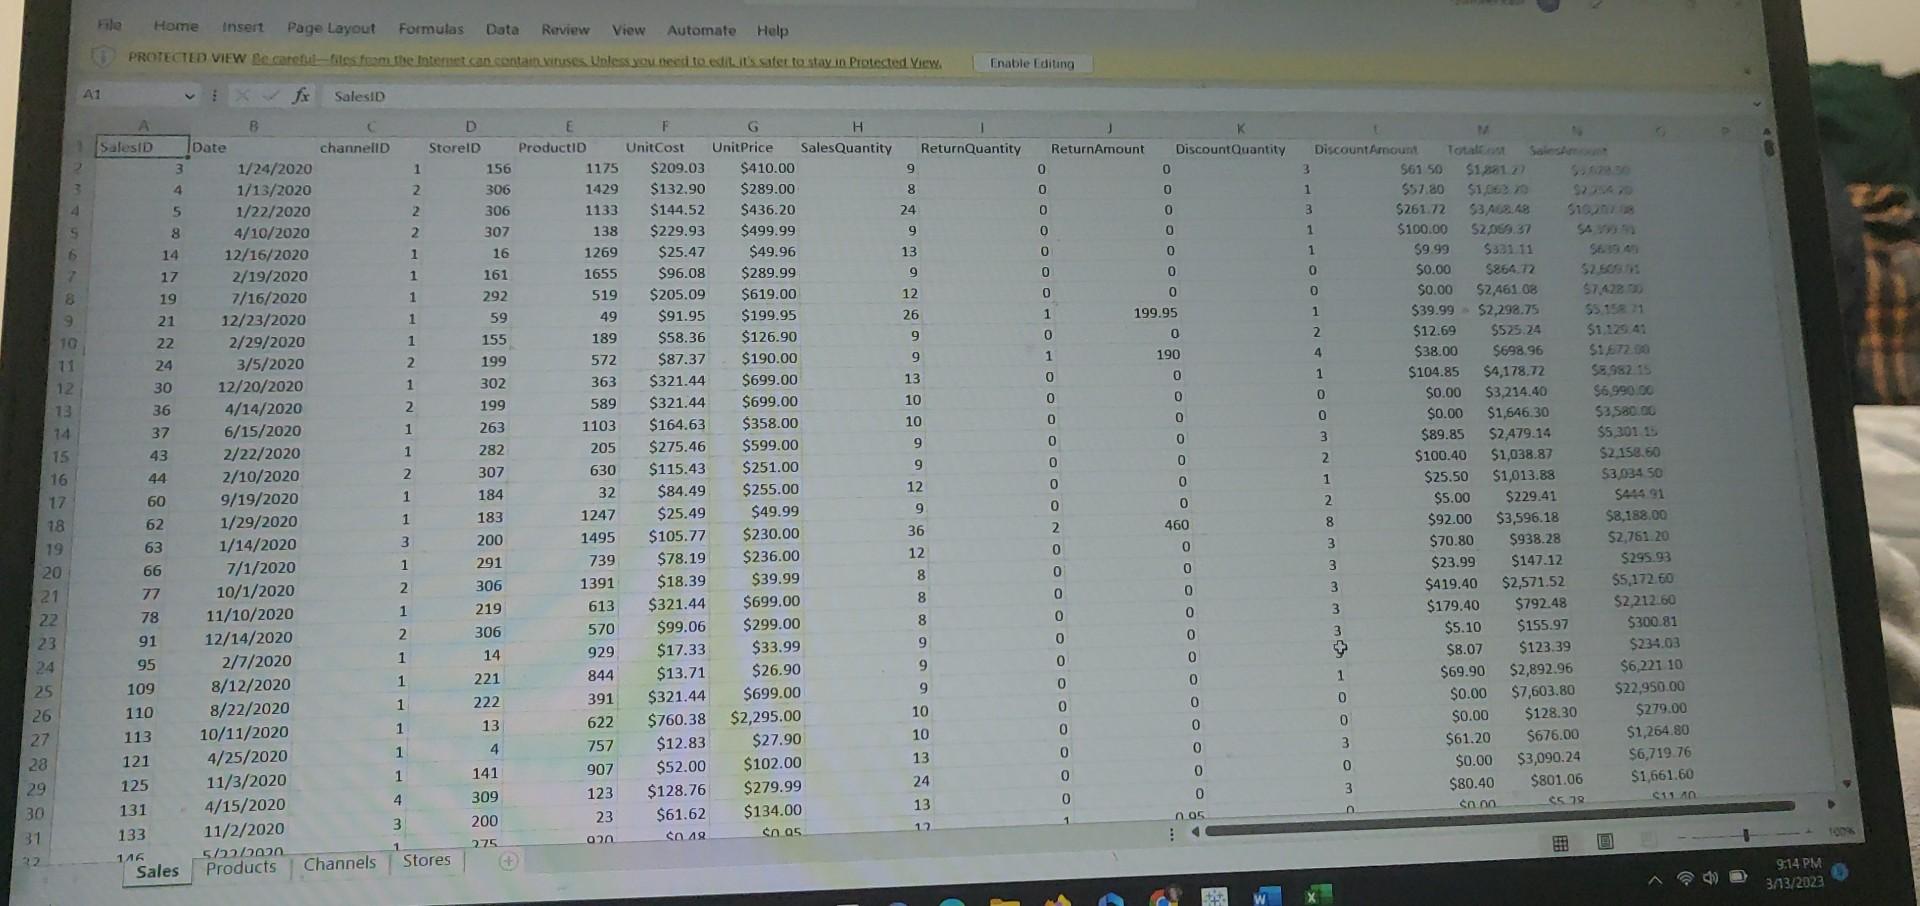
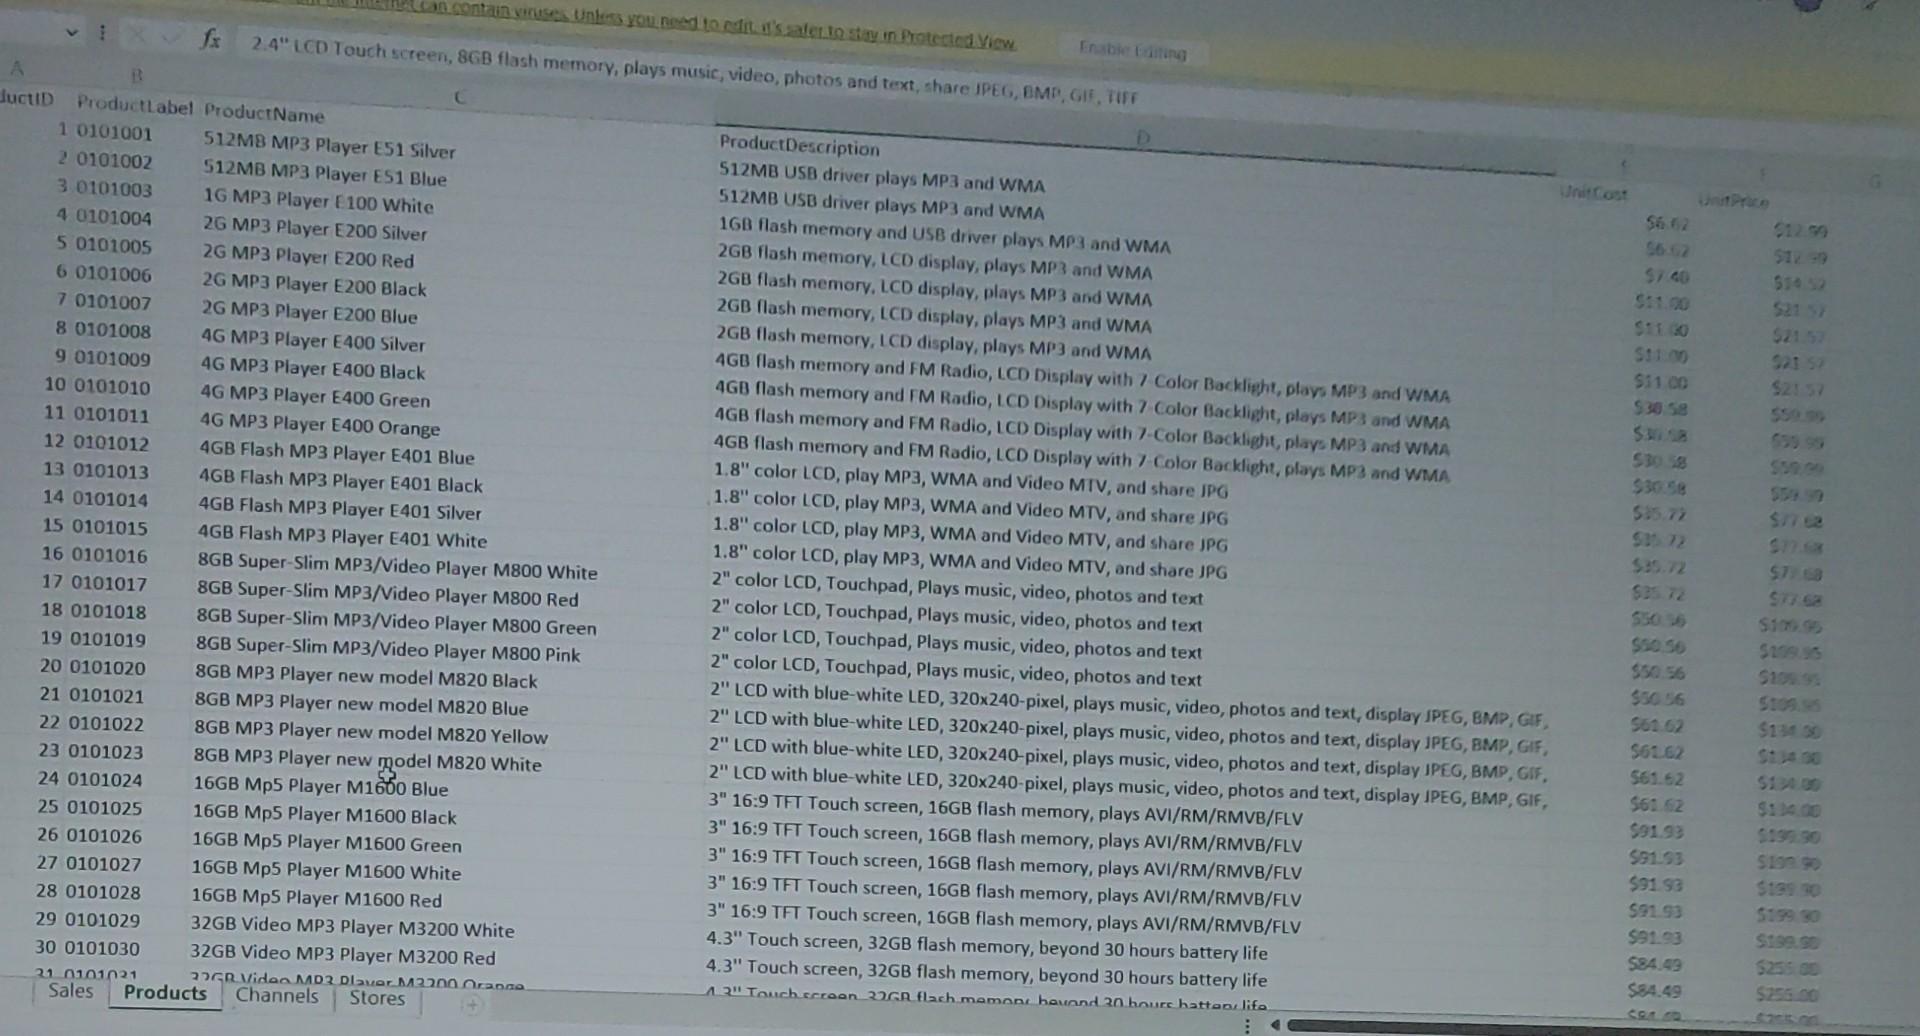
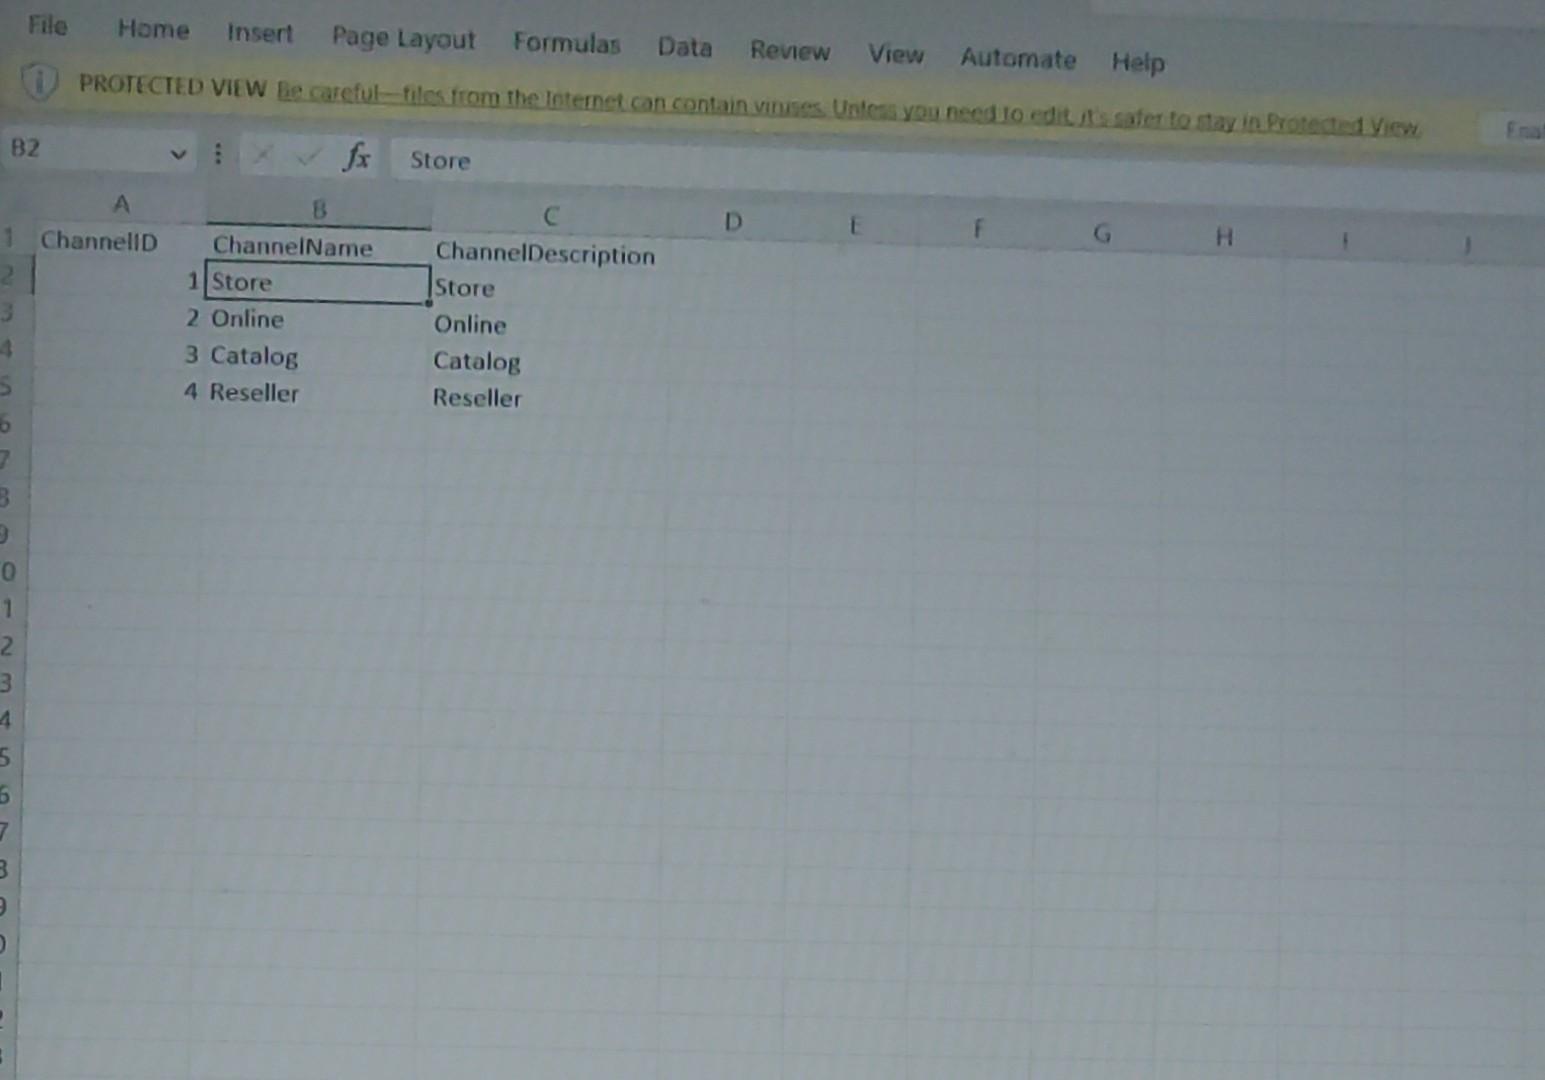
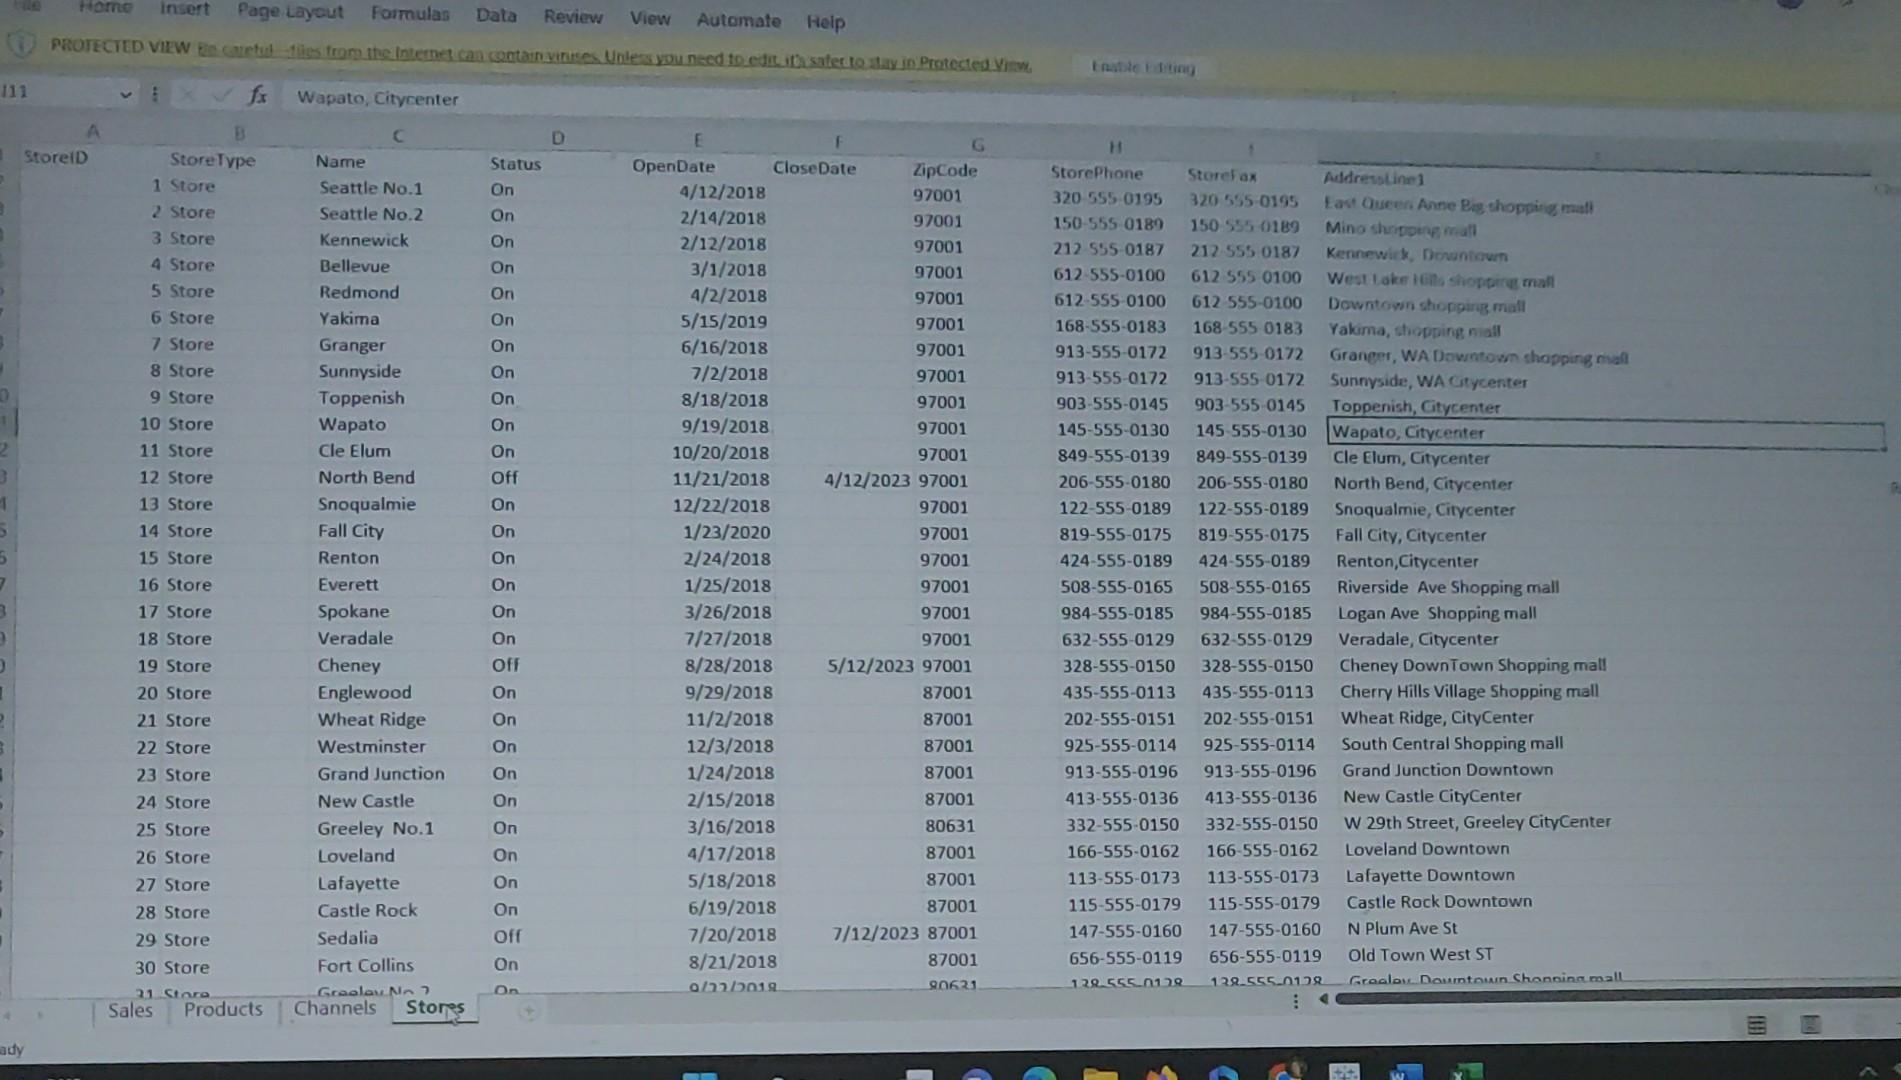
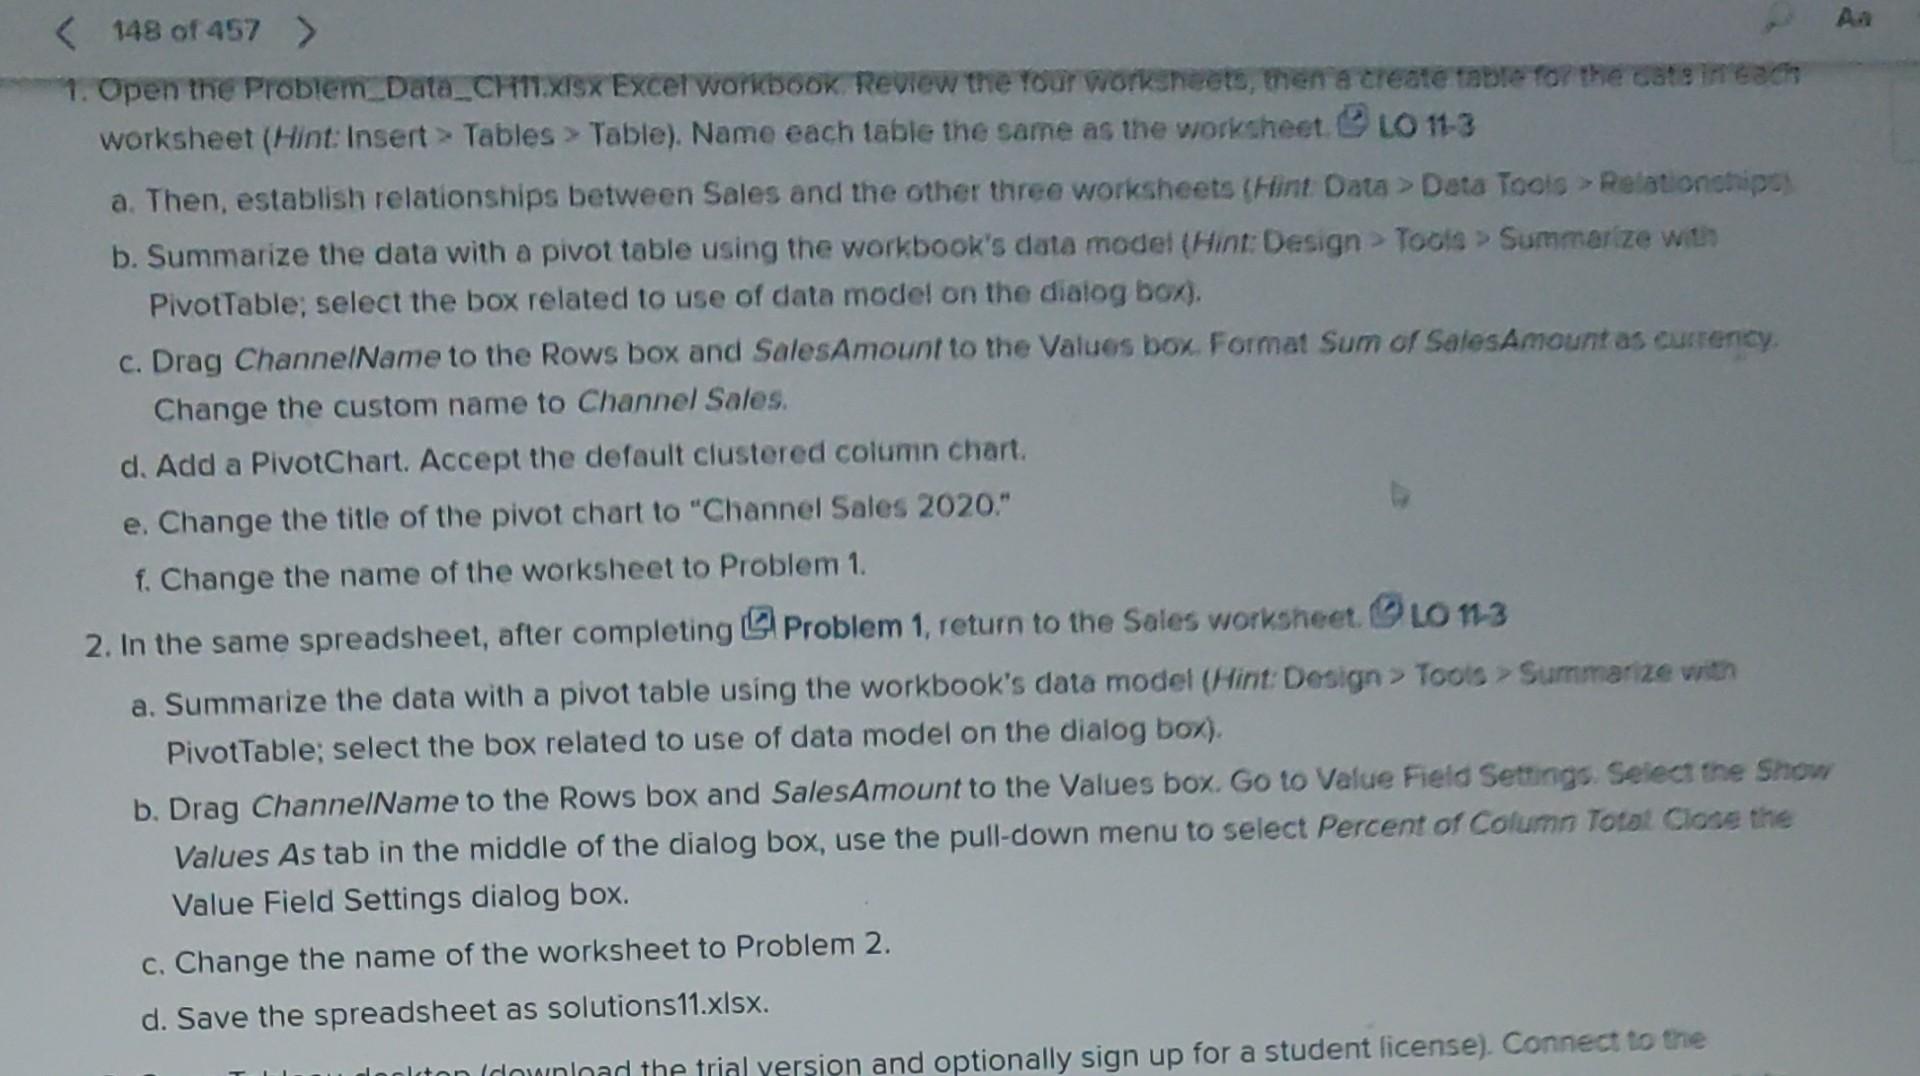
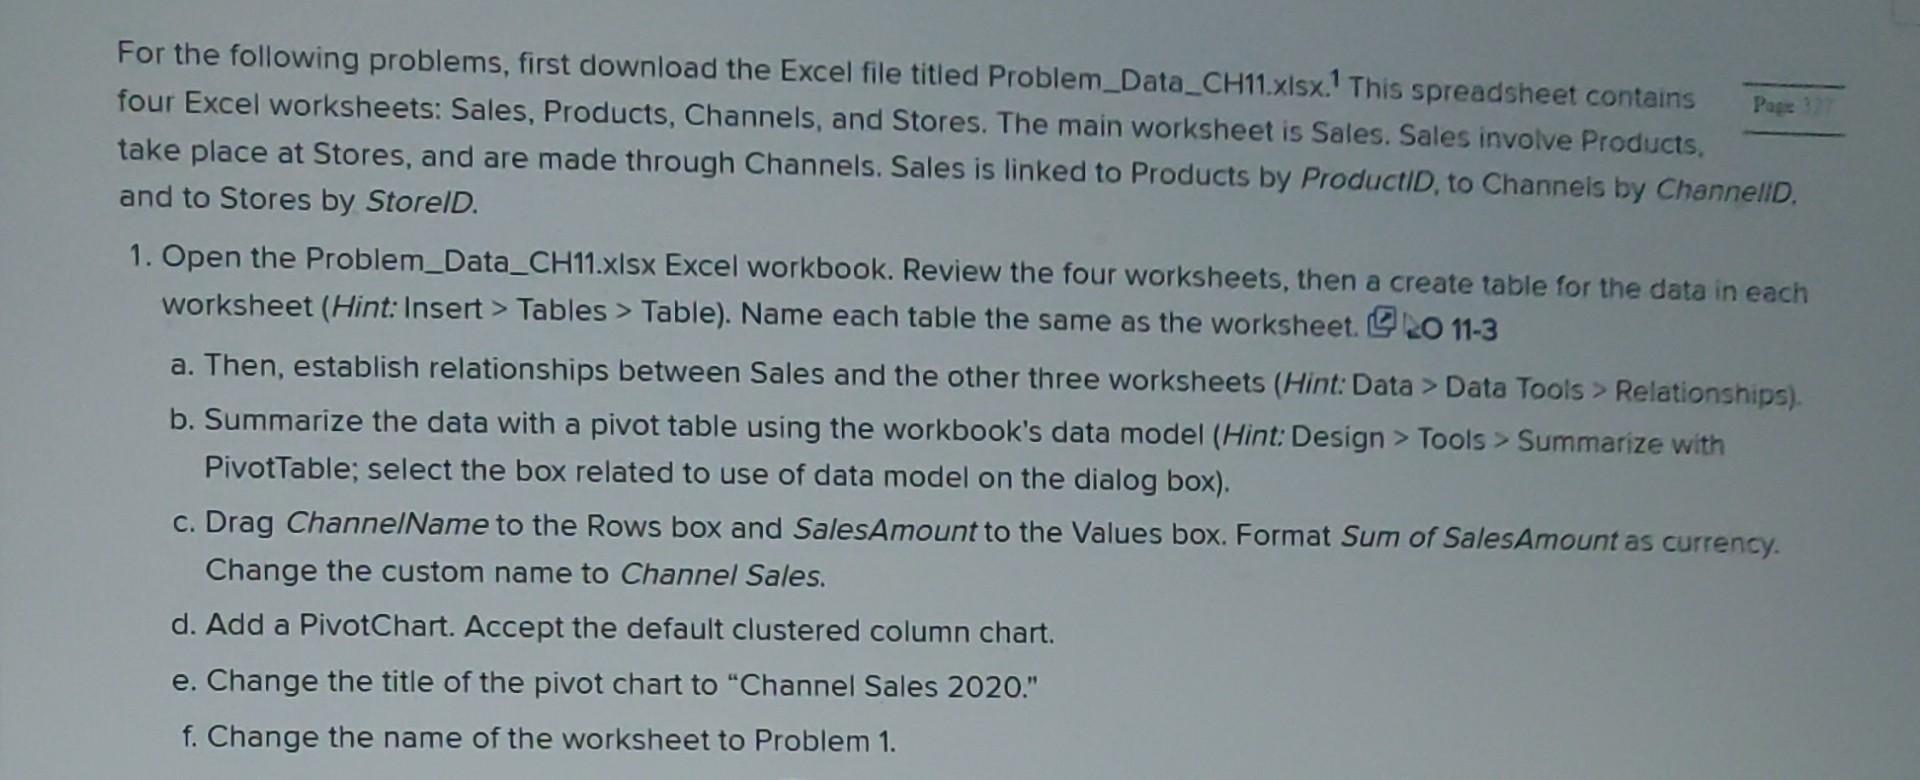

000000000000n0000000+0m0000000 i fx 2.4"LCD Touch screen, 8GB flash memorv, plays music, video, photos and text, share IPEG, EMP, GIf, Tiff Iuctio Productlabel ProductName File Home Insert Page Layout Formulas Data Revew View 82 Home insert Page Laycut Formulas Data Review View Automate Help Inavie i ficiay 1. Open the Problem_Data_CHIT.xsx Excerworkook. Review the four work heoto, then a create tabre for the ost: in 62 fs worksheet (Hint: Insert > Tables > Table). Name each table the same as the worksheet. L0 11.3 a. Then, establish relationships between Sales and the other three worksheets (Hint Data > Data Tools > Relationchipo) b. Summarize the data with a pivot table using the workbook's data modet (Hint: Design > Tocis > Summarize with PivotTable; select the box related to use of data model on the dialog box). c. Drag ChannelName to the Rows box and SalesAmount to the Values box. Format Sum of SalesAmount as eurrency. Change the custom name to Channel Sales. d. Add a PivotChart. Accept the default clustered column chart. e. Change the title of the pivot chart to "Channel Sales 2020 ." f. Change the name of the worksheet to Problem 1. 2. In the same spreadsheet, after completing [( Problem 1, return to the Sales worksheet. 10 L. 3 a. Summarize the data with a pivot table using the workbook's data model (Hint: Dosign > Tools > Summarize with PivotTable; select the box related to use of data model on the dialog box). b. Drag ChannelName to the Rows box and SalesAmount to the Values box. Go to Value Field Settings. Select the Show Values As tab in the middle of the dialog box, use the pull-down menu to select Percent of Column Totat Close the Value Field Settings dialog box. c. Change the name of the worksheet to Problem 2. d. Save the spreadsheet as solutions11.xlsx. For the following problems, first download the Excel file titled Problem_Data_CH11.xlsx.1 This spreadsheet contains four Excel worksheets: Sales, Products, Channels, and Stores. The main worksheet is Sales. Sales involve Products, take place at Stores, and are made through Channels. Sales is linked to Products by ProductiD, to Channeis by Channelli. and to Stores by StorelD. 1. Open the Problem_Data_CH11.xlsx Excel workbook. Review the four worksheets, then a create table for the data in each worksheet (Hint: Insert > Tables > Table). Name each table the same as the worksheet. (4) 11-3 a. Then, establish relationships between Sales and the other three worksheets (Hint: Data > Data Tools > Relationships). b. Summarize the data with a pivot table using the workbook's data model (Hint: Design > Tools > Summarize with PivotTable; select the box related to use of data model on the dialog box). c. Drag ChannelName to the Rows box and SalesAmount to the Values box. Format Sum of SalesAmount as currency. Change the custom name to Channel Sales. d. Add a PivotChart. Accept the default clustered column chart. e. Change the title of the pivot chart to "Channel Sales 2020. ." f. Change the name of the worksheet to Problem 1. 2. In the same spreadsheet, after completing Problem 1, return to the Sales worksheet. 5 LO 113 a. Summarize the data with a pivot table using the workbook's data model (Hint: Design > Toofs > Summarize with PivotTable; select the box related to use of data model on the dialog box). b. Drag ChannelName to the Rows box and SalesAmount to the Values box. Go to Value Field Settings. Select the Show Values As tab in the middle of the dialog box, use the pull-down menu to select Percent of Column Total Close the Value Field Settings dialog box. c. Change the name of the worksheet to Problem 2. d. Save the spreadsheet as solutions11.xlsx. 000000000000n0000000+0m0000000 i fx 2.4"LCD Touch screen, 8GB flash memorv, plays music, video, photos and text, share IPEG, EMP, GIf, Tiff Iuctio Productlabel ProductName File Home Insert Page Layout Formulas Data Revew View 82 Home insert Page Laycut Formulas Data Review View Automate Help Inavie i ficiay 1. Open the Problem_Data_CHIT.xsx Excerworkook. Review the four work heoto, then a create tabre for the ost: in 62 fs worksheet (Hint: Insert > Tables > Table). Name each table the same as the worksheet. L0 11.3 a. Then, establish relationships between Sales and the other three worksheets (Hint Data > Data Tools > Relationchipo) b. Summarize the data with a pivot table using the workbook's data modet (Hint: Design > Tocis > Summarize with PivotTable; select the box related to use of data model on the dialog box). c. Drag ChannelName to the Rows box and SalesAmount to the Values box. Format Sum of SalesAmount as eurrency. Change the custom name to Channel Sales. d. Add a PivotChart. Accept the default clustered column chart. e. Change the title of the pivot chart to "Channel Sales 2020 ." f. Change the name of the worksheet to Problem 1. 2. In the same spreadsheet, after completing [( Problem 1, return to the Sales worksheet. 10 L. 3 a. Summarize the data with a pivot table using the workbook's data model (Hint: Dosign > Tools > Summarize with PivotTable; select the box related to use of data model on the dialog box). b. Drag ChannelName to the Rows box and SalesAmount to the Values box. Go to Value Field Settings. Select the Show Values As tab in the middle of the dialog box, use the pull-down menu to select Percent of Column Totat Close the Value Field Settings dialog box. c. Change the name of the worksheet to Problem 2. d. Save the spreadsheet as solutions11.xlsx. For the following problems, first download the Excel file titled Problem_Data_CH11.xlsx.1 This spreadsheet contains four Excel worksheets: Sales, Products, Channels, and Stores. The main worksheet is Sales. Sales involve Products, take place at Stores, and are made through Channels. Sales is linked to Products by ProductiD, to Channeis by Channelli. and to Stores by StorelD. 1. Open the Problem_Data_CH11.xlsx Excel workbook. Review the four worksheets, then a create table for the data in each worksheet (Hint: Insert > Tables > Table). Name each table the same as the worksheet. (4) 11-3 a. Then, establish relationships between Sales and the other three worksheets (Hint: Data > Data Tools > Relationships). b. Summarize the data with a pivot table using the workbook's data model (Hint: Design > Tools > Summarize with PivotTable; select the box related to use of data model on the dialog box). c. Drag ChannelName to the Rows box and SalesAmount to the Values box. Format Sum of SalesAmount as currency. Change the custom name to Channel Sales. d. Add a PivotChart. Accept the default clustered column chart. e. Change the title of the pivot chart to "Channel Sales 2020. ." f. Change the name of the worksheet to Problem 1. 2. In the same spreadsheet, after completing Problem 1, return to the Sales worksheet. 5 LO 113 a. Summarize the data with a pivot table using the workbook's data model (Hint: Design > Toofs > Summarize with PivotTable; select the box related to use of data model on the dialog box). b. Drag ChannelName to the Rows box and SalesAmount to the Values box. Go to Value Field Settings. Select the Show Values As tab in the middle of the dialog box, use the pull-down menu to select Percent of Column Total Close the Value Field Settings dialog box. c. Change the name of the worksheet to Problem 2. d. Save the spreadsheet as solutions11.xlsx
Step by Step Solution
There are 3 Steps involved in it
Step: 1

Get Instant Access to Expert-Tailored Solutions
See step-by-step solutions with expert insights and AI powered tools for academic success
Step: 2

Step: 3

Ace Your Homework with AI
Get the answers you need in no time with our AI-driven, step-by-step assistance
Get Started


