

Answered step by step
Verified Expert Solution
Question
1 Approved Answer
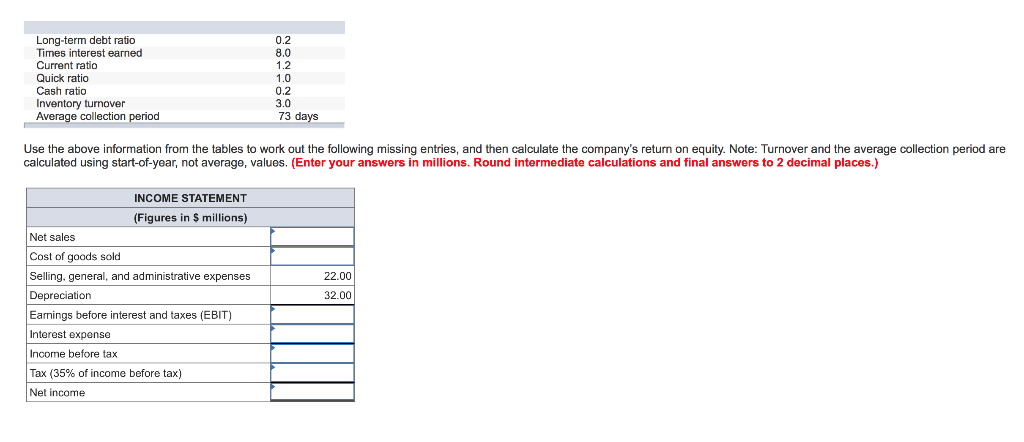
0.2 8.0 1.2 Long-term debt ratio Times interest earned Current ratio Quick ratio Cash ratio Inventory turnover Average collection 0.2 3.0 73 days Use the
Step by Step Solution
There are 3 Steps involved in it
Step: 1

Get Instant Access to Expert-Tailored Solutions
See step-by-step solutions with expert insights and AI powered tools for academic success
Step: 2

Step: 3
Ace Your Homework with AI
Get the answers you need in no time with our AI-driven, step-by-step assistance
Get Started
Introductory Econometrics For Finance
Authors: Chris Brooks
4th Edition
110843682X, 9781108436823