

Answered step by step
Verified Expert Solution
Question
1 Approved Answer
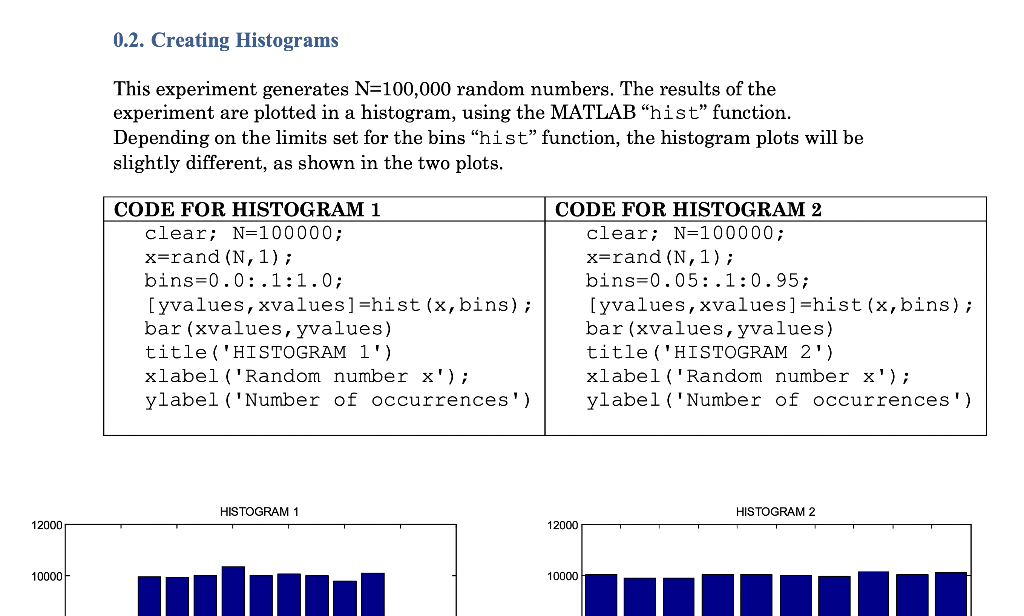
0.2. Creating Histograms This experiment generates N=100,000 random numbers. The results of the experiment are plotted in a histogram, using the MATLAB hist function. Depending
Step by Step Solution
There are 3 Steps involved in it
Step: 1

Get Instant Access to Expert-Tailored Solutions
See step-by-step solutions with expert insights and AI powered tools for academic success
Step: 2

Step: 3
Ace Your Homework with AI
Get the answers you need in no time with our AI-driven, step-by-step assistance
Get Started
Machine Learning And Knowledge Discovery In Databases European Conference Ecml Pkdd 2019 Wurzburg Germany September 16 20 2019 Proceedings Part 2 Lnai 11907
Authors: Ulf Brefeld ,Elisa Fromont ,Andreas Hotho ,Arno Knobbe ,Marloes Maathuis ,Celine Robardet
1st Edition