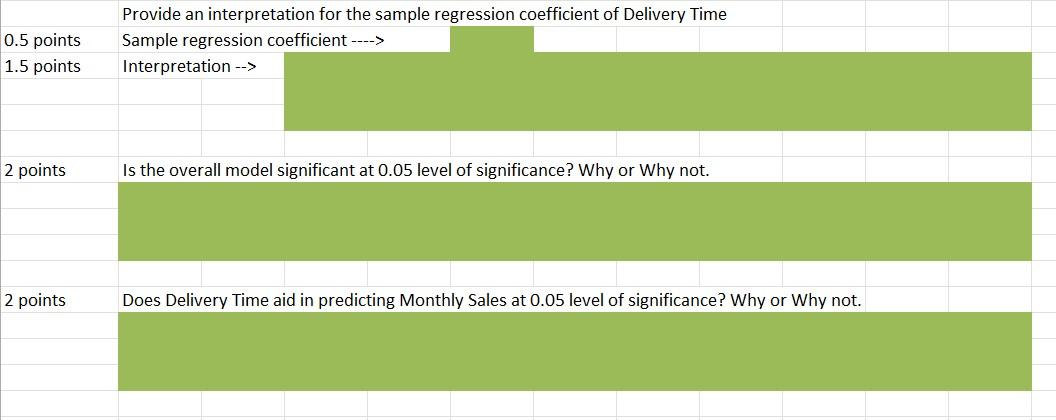
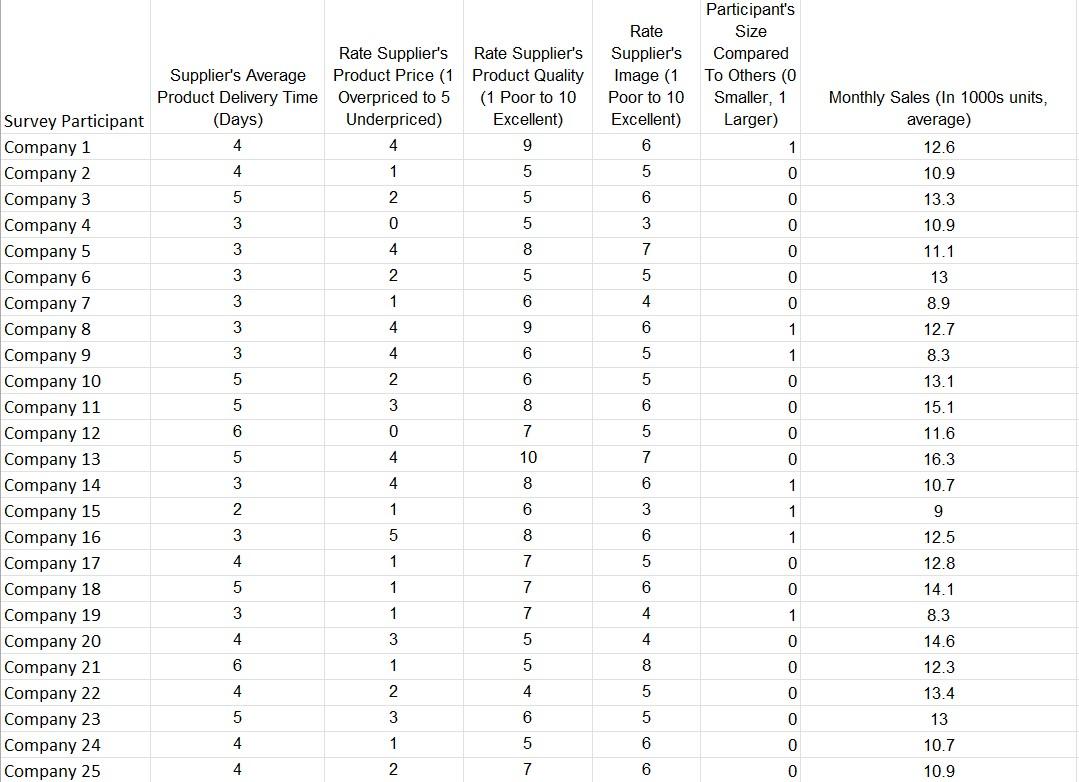
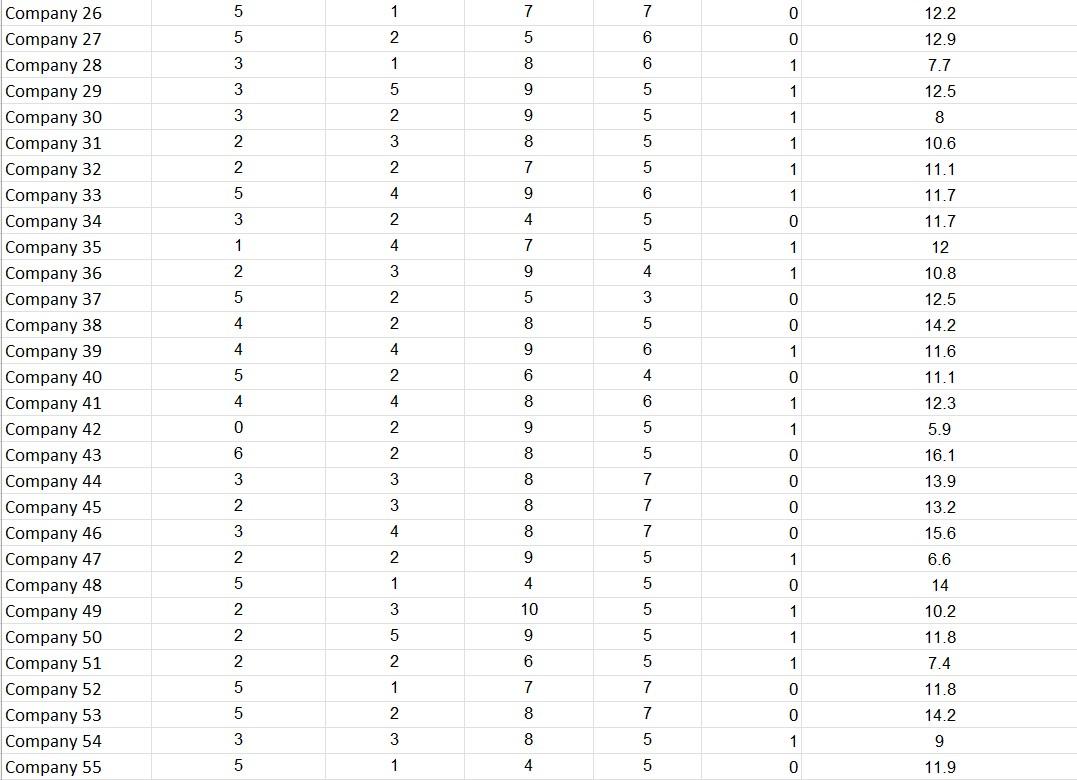
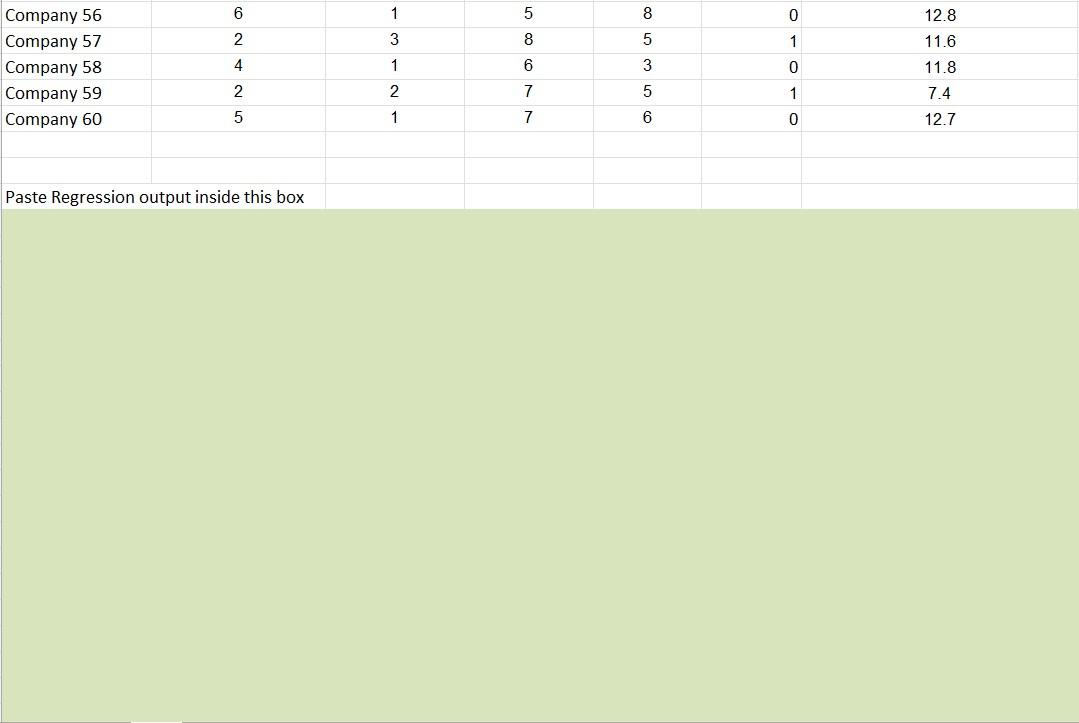
0.5 points 1.5 points Provide an interpretation for the sample regression coefficient of Delivery Time Sample regression coefficient ----> Interpretation --> 2 points Is the overall model significant at 0.05 level of significance? Why or Why not. 2 points Does Delivery Time aid in predicting Monthly Sales at 0.05 level of significance? Why or Why not. Rate Supplier's Rate Supplier's Product Price (1 Product Quality Overpriced to 5 (1 Poor to 10 Underpriced) Excellent) 4 9 Supplier's Average Product Delivery Time (Days) 4 Participant's Size Compared To Others (O Smaller, 1 Larger) Rate Supplier's Image (1 Poor to 10 Excellent) 6 Monthly Sales (In 1000s units, average) 12.6 1 4 1 5 5 0 10.9 5 2 5 6 0 13.3 3 0 5 3 0 10.9 11.1 3 4 8 7 0 3 2 5 5 0 13 3 1 6 4 0 8.9 3 4 9 6 1 12.7 8.3 3 6 5 1 5 6 5 0 13.1 4 2 3 0 5 8 6 0 15.1 11.6 6 7 5 0 Survey Participant Company 1 Company 2 Company 3 Company 4 Company 5 Company 6 Company 7 Company 8 Company 9 Company 10 Company 11 Company 12 Company 13 Company 14 Company 15 Company 16 Company 17 Company 18 Company 19 Company 20 Company 21 Company 22 Company 23 Company 24 Company 25 5 4 10 7 0 3 4 8 6 1 16.3 10.7 9 2 1 6 3 1 3 5 8 6 1 12.5 4 1 7 5 0 5 1 7 6 0 12.8 14.1 8.3 3 7 4 1 1 3 4 5 4 0 14.6 6 1 5 8 0 12.3 13.4 4 2 4 5 0 5 3 . 6 5 0 13 4 1 5 6 0 10.7 10.9 4 2 7 6 0 5 1 7 7 0 12.2 5 2 5 6 0 12.9 1 8 6 1 3 3 3 7.7 12.5 5 9 5 1 2 9 5 1 8 2 3 8 5 1 10.6 2 2 7 5 1 4 9 6 1 5 3 11.1 11.7 11.7 2 4 5 0 0 1 4 7 5 1 12 2 3 9 9 4 4 1 10.8 5 2 3 0 0 12.5 14.2 4 4 2 5 5 8 8 9 9 5 0 4 4 4 6 1 11.6 5 2 6 4 0 Company 26 Company 27 Company 28 Company 29 Company 30 Company 31 Company 32 Company 33 Company 34 Company 35 Company 36 Company 37 Company 38 Company 39 Company 40 Company 41 Company 42 Company 43 Company 44 Company 45 Company 46 Company 47 Company 48 Company 49 Company 50 Company 51 Company 52 Company 53 Company 54 Company 55 11.1 12.3 4 4 8 6 1 0 2 9 9 5 1 5.9 6 2 8 5 0 16.1 13.9 3 3 8 7 0 2 3 8 8 7 0 13.2 3 4 8 7 0 15.6 2 2 9 5 1 6.6 5 4 4 5 0 14 2 10 5 1 10.2 1 3 5 2 2 9 5 1 1 11.8 2 6 5 1 7.4 5 1 7 7 0 11.8 5 2 8 0 14.2 7 7 5 3 3 8 1 9 5 1 4 5 0 11.9 6 1 5 8 0 12.8 2 3 8 5 1 Company 56 Company 57 Company 58 Company 59 Company 60 11.6 11.8 4 1 6 3 0 2 2 7 5 1 7.4 5 1 7 6 0 12.7 Paste Regression output inside this box 0.5 points 1.5 points Provide an interpretation for the sample regression coefficient of Delivery Time Sample regression coefficient ----> Interpretation --> 2 points Is the overall model significant at 0.05 level of significance? Why or Why not. 2 points Does Delivery Time aid in predicting Monthly Sales at 0.05 level of significance? Why or Why not. Rate Supplier's Rate Supplier's Product Price (1 Product Quality Overpriced to 5 (1 Poor to 10 Underpriced) Excellent) 4 9 Supplier's Average Product Delivery Time (Days) 4 Participant's Size Compared To Others (O Smaller, 1 Larger) Rate Supplier's Image (1 Poor to 10 Excellent) 6 Monthly Sales (In 1000s units, average) 12.6 1 4 1 5 5 0 10.9 5 2 5 6 0 13.3 3 0 5 3 0 10.9 11.1 3 4 8 7 0 3 2 5 5 0 13 3 1 6 4 0 8.9 3 4 9 6 1 12.7 8.3 3 6 5 1 5 6 5 0 13.1 4 2 3 0 5 8 6 0 15.1 11.6 6 7 5 0 Survey Participant Company 1 Company 2 Company 3 Company 4 Company 5 Company 6 Company 7 Company 8 Company 9 Company 10 Company 11 Company 12 Company 13 Company 14 Company 15 Company 16 Company 17 Company 18 Company 19 Company 20 Company 21 Company 22 Company 23 Company 24 Company 25 5 4 10 7 0 3 4 8 6 1 16.3 10.7 9 2 1 6 3 1 3 5 8 6 1 12.5 4 1 7 5 0 5 1 7 6 0 12.8 14.1 8.3 3 7 4 1 1 3 4 5 4 0 14.6 6 1 5 8 0 12.3 13.4 4 2 4 5 0 5 3 . 6 5 0 13 4 1 5 6 0 10.7 10.9 4 2 7 6 0 5 1 7 7 0 12.2 5 2 5 6 0 12.9 1 8 6 1 3 3 3 7.7 12.5 5 9 5 1 2 9 5 1 8 2 3 8 5 1 10.6 2 2 7 5 1 4 9 6 1 5 3 11.1 11.7 11.7 2 4 5 0 0 1 4 7 5 1 12 2 3 9 9 4 4 1 10.8 5 2 3 0 0 12.5 14.2 4 4 2 5 5 8 8 9 9 5 0 4 4 4 6 1 11.6 5 2 6 4 0 Company 26 Company 27 Company 28 Company 29 Company 30 Company 31 Company 32 Company 33 Company 34 Company 35 Company 36 Company 37 Company 38 Company 39 Company 40 Company 41 Company 42 Company 43 Company 44 Company 45 Company 46 Company 47 Company 48 Company 49 Company 50 Company 51 Company 52 Company 53 Company 54 Company 55 11.1 12.3 4 4 8 6 1 0 2 9 9 5 1 5.9 6 2 8 5 0 16.1 13.9 3 3 8 7 0 2 3 8 8 7 0 13.2 3 4 8 7 0 15.6 2 2 9 5 1 6.6 5 4 4 5 0 14 2 10 5 1 10.2 1 3 5 2 2 9 5 1 1 11.8 2 6 5 1 7.4 5 1 7 7 0 11.8 5 2 8 0 14.2 7 7 5 3 3 8 1 9 5 1 4 5 0 11.9 6 1 5 8 0 12.8 2 3 8 5 1 Company 56 Company 57 Company 58 Company 59 Company 60 11.6 11.8 4 1 6 3 0 2 2 7 5 1 7.4 5 1 7 6 0 12.7 Paste Regression output inside this box