Answered step by step
Verified Expert Solution
Link Copied!

Question

1 Approved Answer

07:38 Mon 29. Nov 67 % TOO + Lesson 10.2.2: Executing the Chi-Square Test for Independence A Do these data support the claim that there
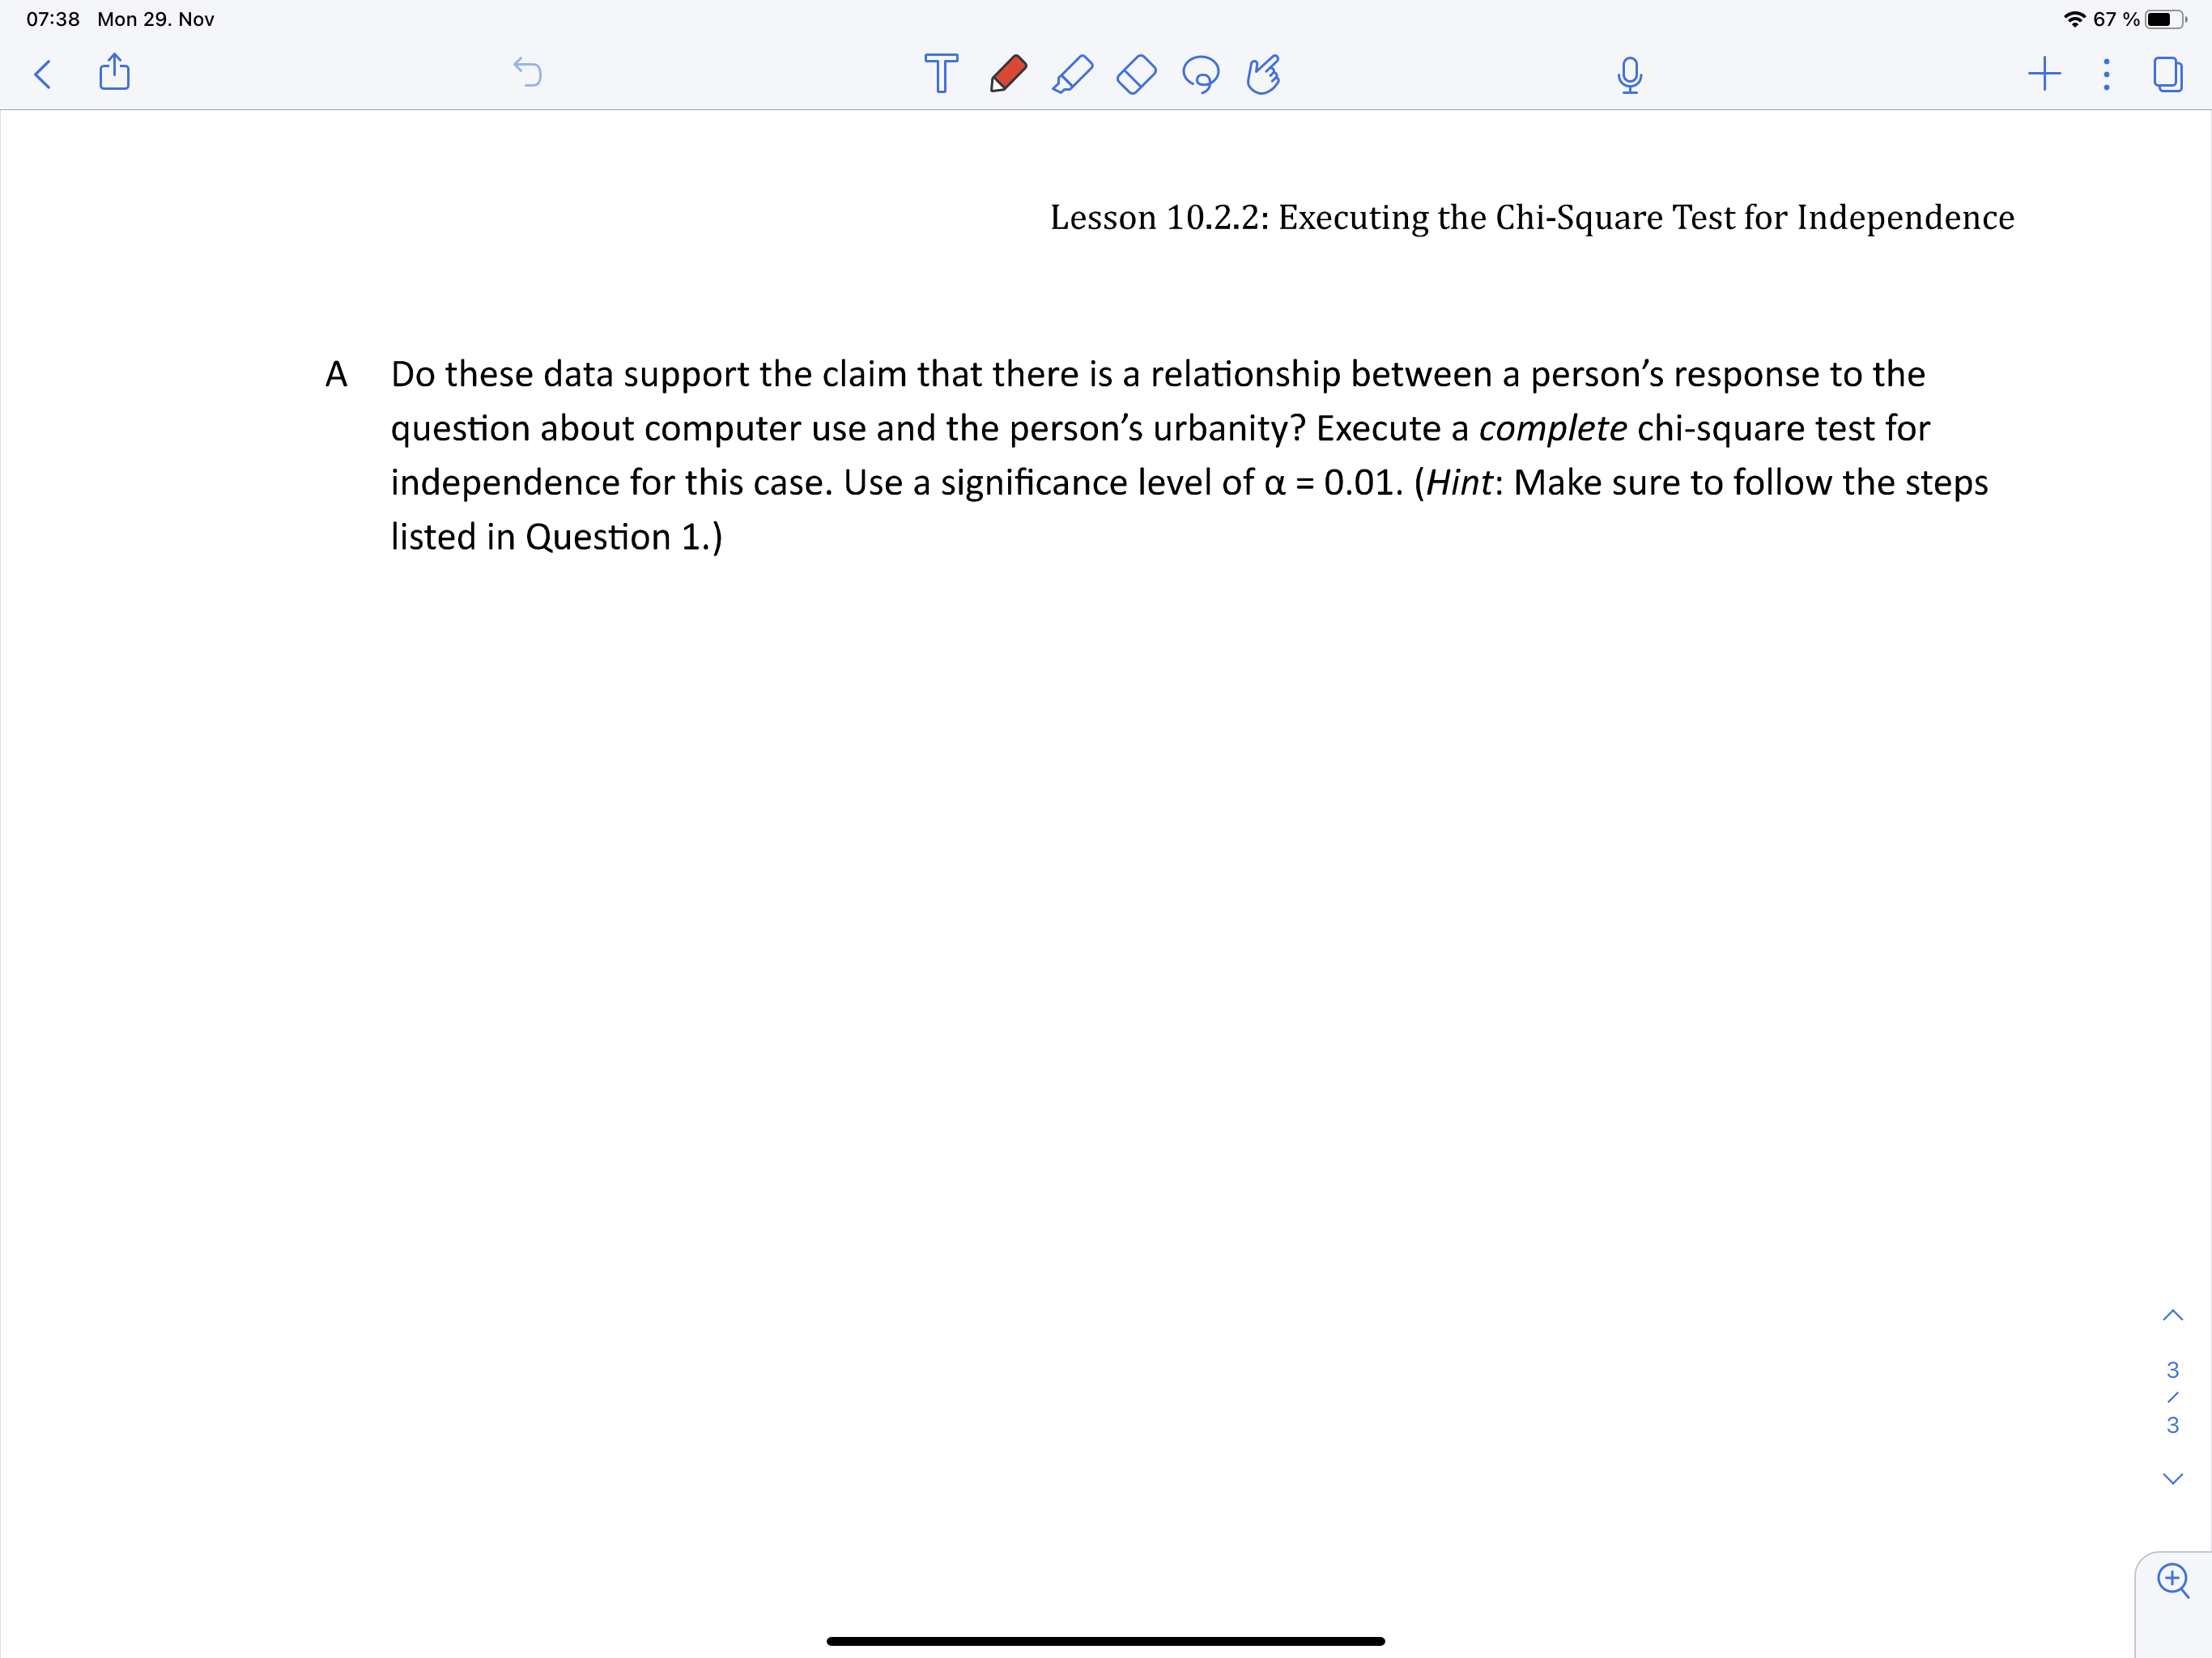
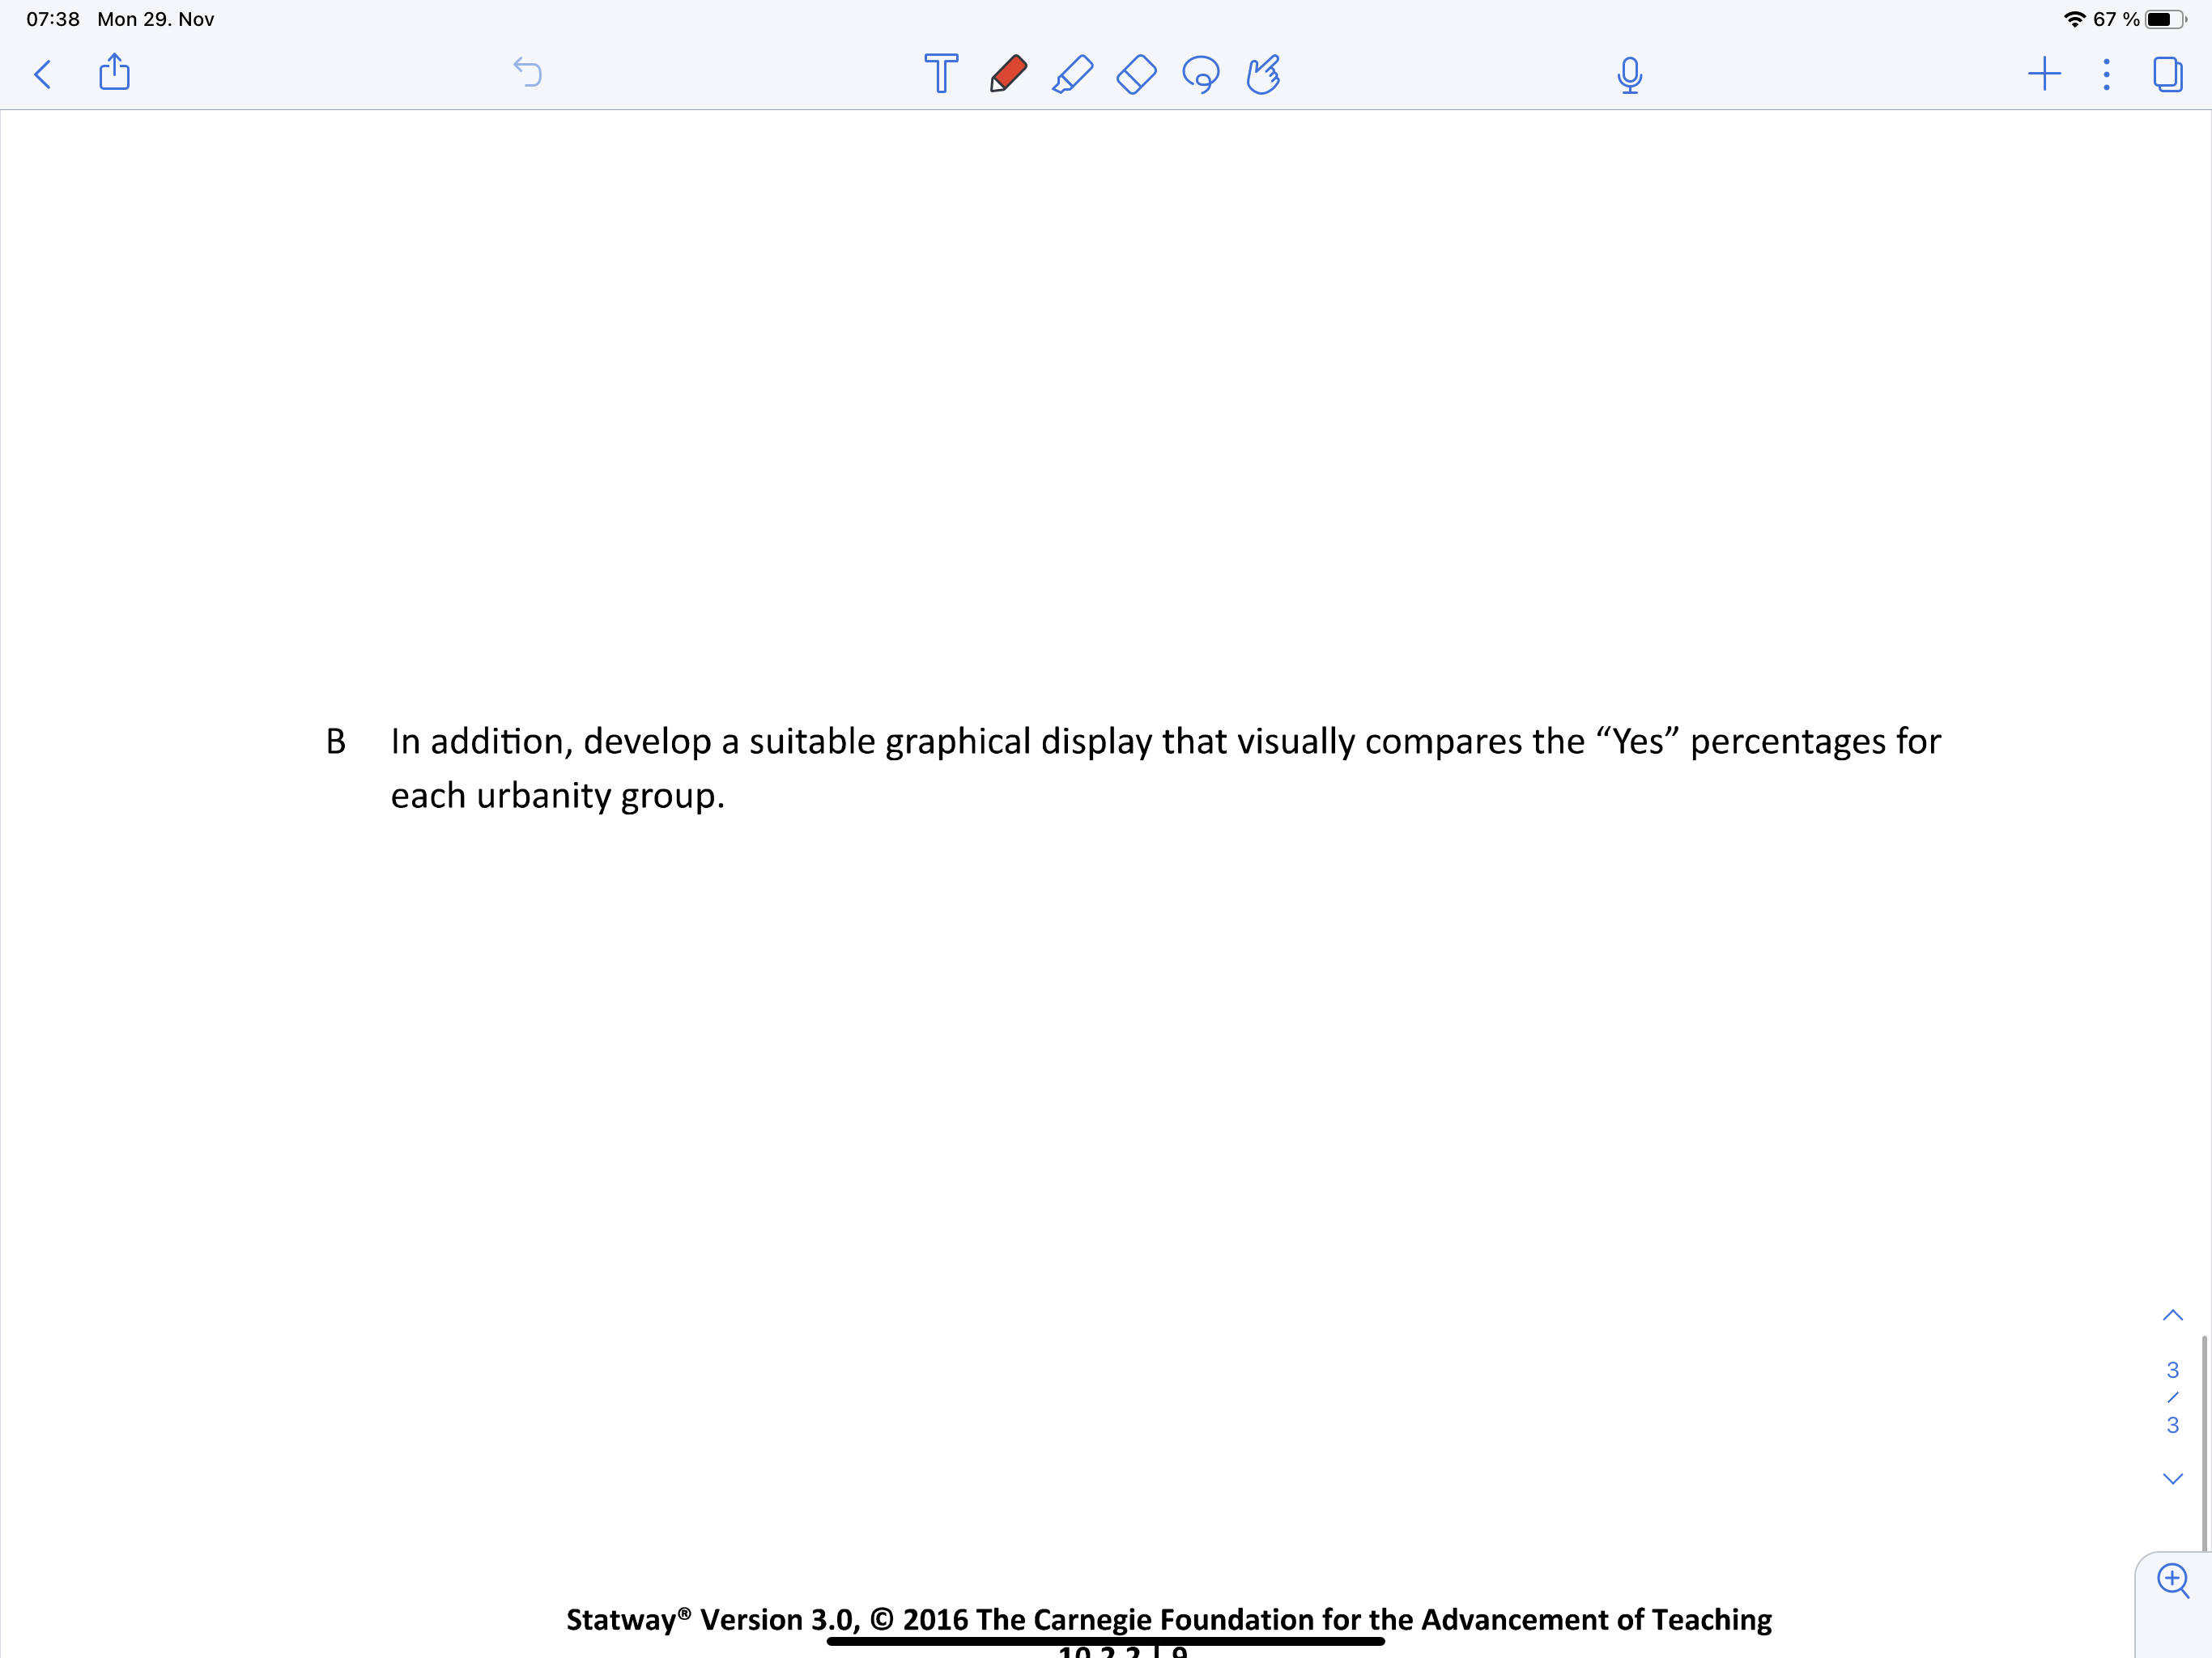
image text in transcribedimage text in transcribedimage text in transcribed
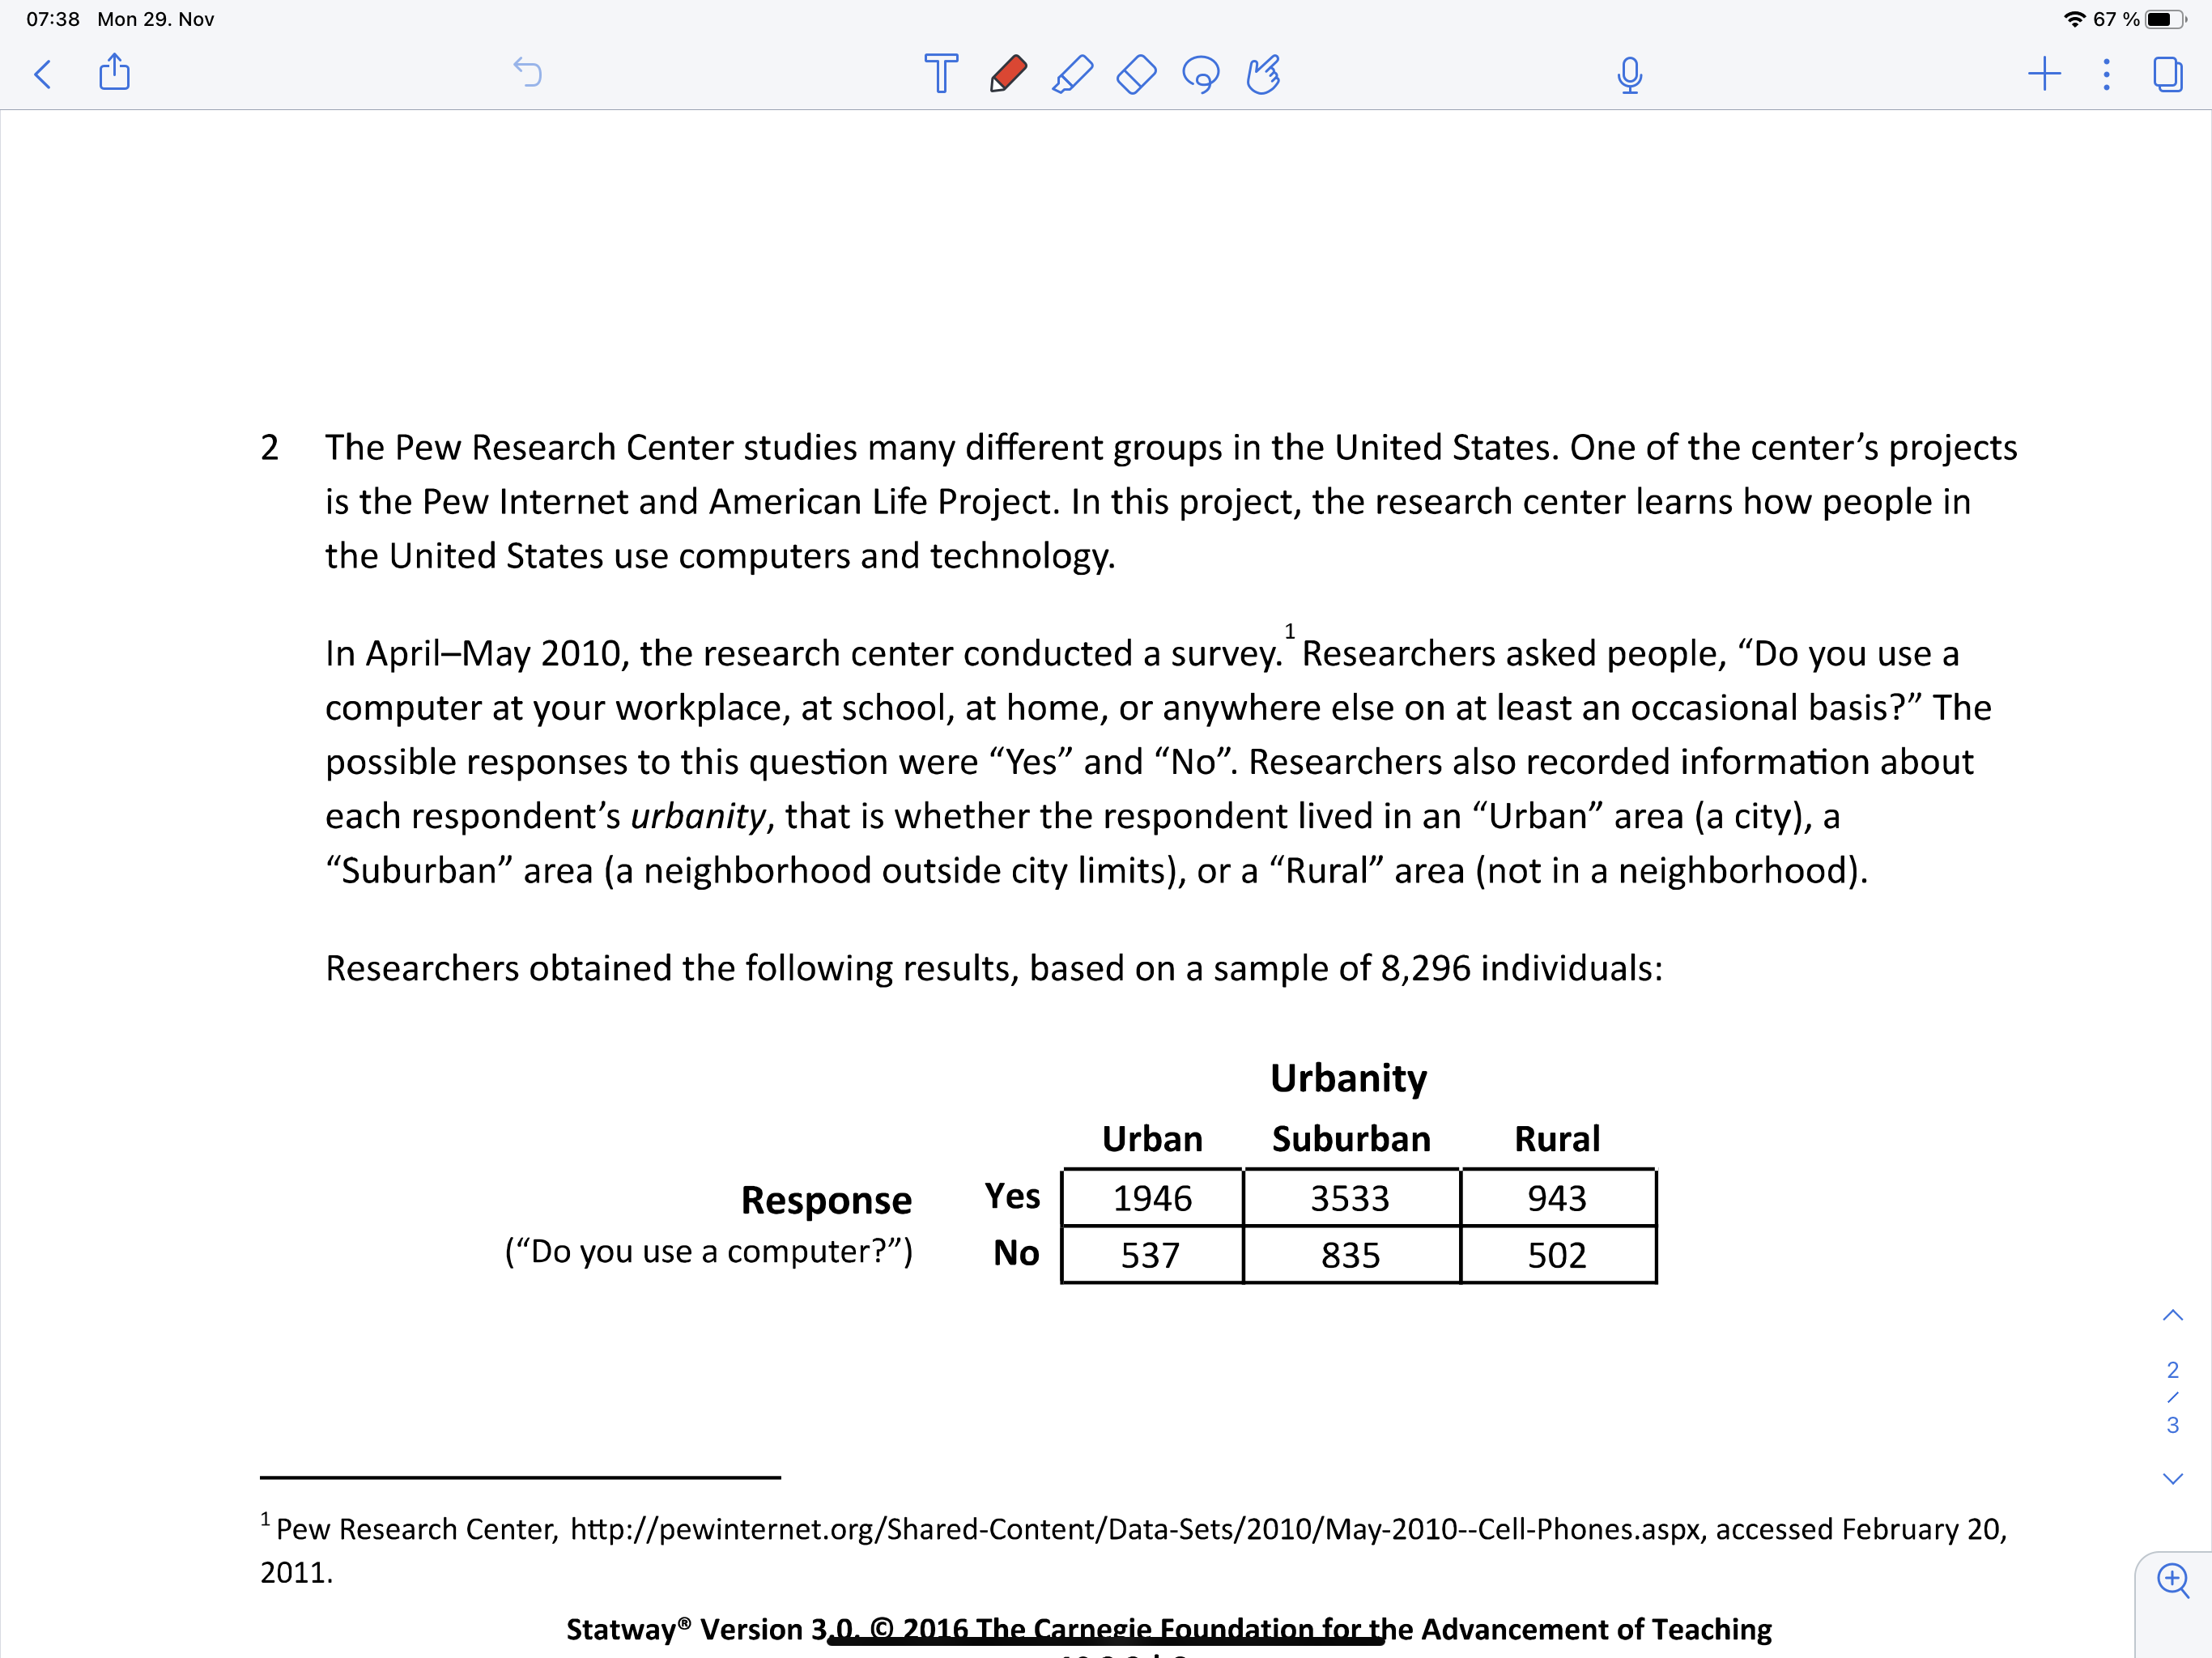
07:38 Mon 29. Nov 67 % TOO + Lesson 10.2.2: Executing the Chi-Square Test for Independence A Do these data support the claim that there is a relationship between a person's response to the question about computer use and the person's urbanity? Execute a complete chi-square test for independence for this case. Use a significance level of a = 0.01. (Hint: Make sure to follow the steps listed in Question 1.) w \\ w >07:38 Mon 29. Nov 67 % TOD + : 0 B In addition, develop a suitable graphical display that visually compares the "Yes" percentages for each urbanity group. w \\ w > Statway Version 3.0, @ 2016 The Carnegie Foundation for the Advancement of Teaching07:38 Mon 29. Nov '5' 67 Wei}
Step by Step Solution

There are 3 Steps involved in it

Step: 1

blur-text-image

Get Instant Access to Expert-Tailored Solutions

See step-by-step solutions with expert insights and AI powered tools for academic success

Step: 2

blur-text-image

Step: 3

blur-text-image

Ace Your Homework with AI

Get the answers you need in no time with our AI-driven, step-by-step assistance

Get Started

Recommended Textbook for

More Books

Students also viewed these Mathematics questions

Question

Describe the difference between formal and informal mediation.

Answered: 1 week ago

Question

What are some of the possible scenes from our future?

Answered: 1 week ago