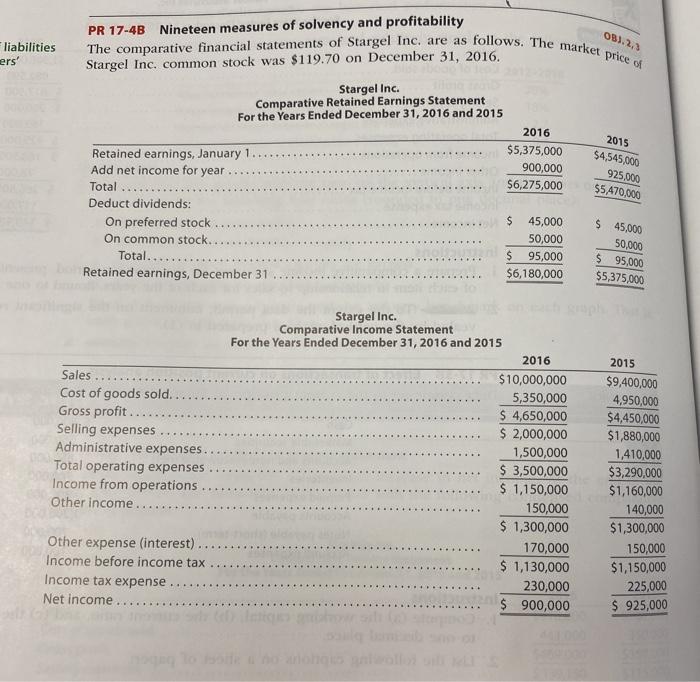
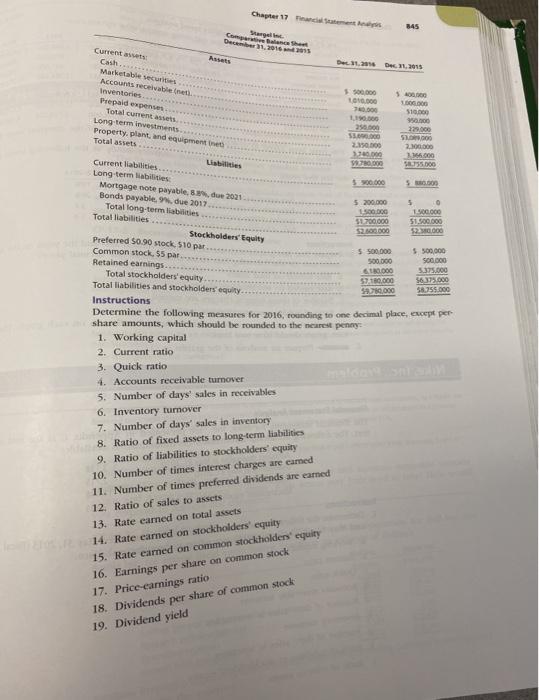
083.2.3 liabilities ers' PR 17-4B The comparative financial statements of Stargel Inc. are as follows. The market price of Nineteen measures of solvency and profitability Stargel Inc. common stock was $119.70 on December 31, 2016. Stargel Inc. Comparative Retained Earnings Statement For the Years Ended December 31, 2016 and 2015 2016 Retained earnings, January 1 $5,375,000 Add net income for year 900,000 Total $6,275,000 Deduct dividends: $ On preferred stock 45,000 On common stock. 50,000 Total. $ 95,000 Retained earnings, December 31 $6,180,000 2015 $4,545,000 925,000 55470,000 $ 45,000 50.000 $ 95,000 $5,375,000 Sales Cost of goods sold. Gross profit... Selling expenses Administrative expenses. Total operating expenses Income from operations Other income. Stargel Inc. Comparative Income Statement For the Years Ended December 31, 2016 and 2015 2016 $10,000,000 5,350,000 $ 4,650,000 $ 2,000,000 1,500,000 $ 3,500,000 $ 1,150,000 150,000 $ 1,300,000 170,000 $ 1,130,000 230,000 $ 900,000 2015 $9.400,000 4,950,000 $4,450,000 $1,880,000 1,410,000 $3,290,000 $1,160,000 140,000 $1,300,000 150,000 $1,150,000 225,000 $ 925,000 Other expense (interest) Income before income tax Income tax expense Net income Chapter 17 cente 845 Star December 1, 2016 2015 Come Balance Sheet Dec. Des 2015 550.000 . 500 $10.00 10.000 250.000 Current asset Cash Marketable securities Accounts receivable et Inventories Prepaid expenses Total current assets Long term investments Property, plant and equipment in Total assets Lataries | Current liabilities Long-term liabilities Mortgage note payable, 8., due 2021 Bonds payable..due 2017 Total long-term liabilities Total liabilities Stockholders' Equity Preferred $0.90 stock. 510 par Common stock, 55 par Retained earnings Total stockholders' equity Total liabilities and stockholders' equity S. 200.000 135.000 2.150.000 3.700.000 WODO 500.000 5 200.000 1.500.000 51 700.000 $2.500.000 5 1.500.000 51.500.000 S2000 $ 500.000 $ 500,000 500.000 500.000 180.000 5375.000 57 10 000 56375.000 50.000 58.755.000 Instructions Determine the following measures for 2016, rounding to one desimal place, except per share amounts, which should be rounded to the nearest penny 1. Working capital 2. Current ratio 3. Quick ratio 4. Accounts receivable turnover 5. Number of days' sales in receivables 6. Inventory turnover 7. Number of days' sales in inventory 8. Ratio of fixed assets to long-term liabilities 9. Ratio of liabilities to stockholders' equity 10. Number of times interest charges are cared 11. Number of times preferred dividends are earned 12. Ratio of sales to assets 13. Rate eamed on total assets 14. Rate earned on stockholders' equity 15. Rate eamed on common stockholders' equity 16. Earnings per share on common stock 17. Price-earings ratio 18. Dividends per share of common stock 19. Dividend yield 083.2.3 liabilities ers' PR 17-4B The comparative financial statements of Stargel Inc. are as follows. The market price of Nineteen measures of solvency and profitability Stargel Inc. common stock was $119.70 on December 31, 2016. Stargel Inc. Comparative Retained Earnings Statement For the Years Ended December 31, 2016 and 2015 2016 Retained earnings, January 1 $5,375,000 Add net income for year 900,000 Total $6,275,000 Deduct dividends: $ On preferred stock 45,000 On common stock. 50,000 Total. $ 95,000 Retained earnings, December 31 $6,180,000 2015 $4,545,000 925,000 55470,000 $ 45,000 50.000 $ 95,000 $5,375,000 Sales Cost of goods sold. Gross profit... Selling expenses Administrative expenses. Total operating expenses Income from operations Other income. Stargel Inc. Comparative Income Statement For the Years Ended December 31, 2016 and 2015 2016 $10,000,000 5,350,000 $ 4,650,000 $ 2,000,000 1,500,000 $ 3,500,000 $ 1,150,000 150,000 $ 1,300,000 170,000 $ 1,130,000 230,000 $ 900,000 2015 $9.400,000 4,950,000 $4,450,000 $1,880,000 1,410,000 $3,290,000 $1,160,000 140,000 $1,300,000 150,000 $1,150,000 225,000 $ 925,000 Other expense (interest) Income before income tax Income tax expense Net income Chapter 17 cente 845 Star December 1, 2016 2015 Come Balance Sheet Dec. Des 2015 550.000 . 500 $10.00 10.000 250.000 Current asset Cash Marketable securities Accounts receivable et Inventories Prepaid expenses Total current assets Long term investments Property, plant and equipment in Total assets Lataries | Current liabilities Long-term liabilities Mortgage note payable, 8., due 2021 Bonds payable..due 2017 Total long-term liabilities Total liabilities Stockholders' Equity Preferred $0.90 stock. 510 par Common stock, 55 par Retained earnings Total stockholders' equity Total liabilities and stockholders' equity S. 200.000 135.000 2.150.000 3.700.000 WODO 500.000 5 200.000 1.500.000 51 700.000 $2.500.000 5 1.500.000 51.500.000 S2000 $ 500.000 $ 500,000 500.000 500.000 180.000 5375.000 57 10 000 56375.000 50.000 58.755.000 Instructions Determine the following measures for 2016, rounding to one desimal place, except per share amounts, which should be rounded to the nearest penny 1. Working capital 2. Current ratio 3. Quick ratio 4. Accounts receivable turnover 5. Number of days' sales in receivables 6. Inventory turnover 7. Number of days' sales in inventory 8. Ratio of fixed assets to long-term liabilities 9. Ratio of liabilities to stockholders' equity 10. Number of times interest charges are cared 11. Number of times preferred dividends are earned 12. Ratio of sales to assets 13. Rate eamed on total assets 14. Rate earned on stockholders' equity 15. Rate eamed on common stockholders' equity 16. Earnings per share on common stock 17. Price-earings ratio 18. Dividends per share of common stock 19. Dividend yield