

Answered step by step
Verified Expert Solution
Question
1 Approved Answer
08:58 Simon Company's year-end balance sheets follow. At December 31 Assets Cash Accounts receivable, net Merchandise inventory Prepaid expenses Plant assets, net Total assets Liabilities
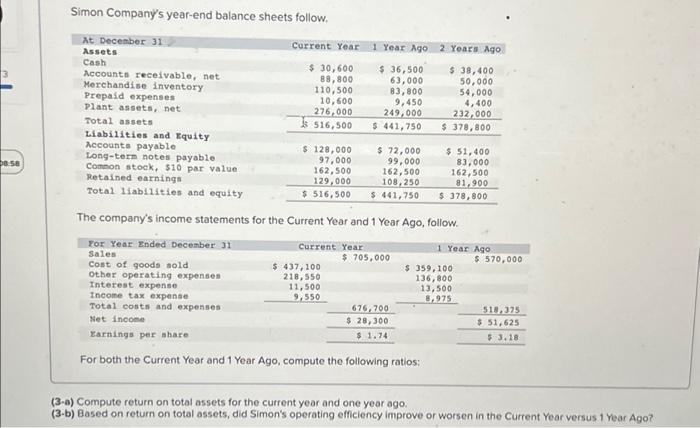
08:58 Simon Company's year-end balance sheets follow. At December 31 Assets Cash Accounts receivable, net Merchandise inventory Prepaid expenses Plant assets, net Total assets Liabilities and Equity Accounts payable Long-term notes payable Common stock, $10 par value Retained earnings Total liabilities and equity Interest expense Income tax expense Total costs and expenses Net income Current Year Earnings per share $ 30,600 88,800 110,500 10,600 276,000 516,500 1 Year Ago $ 128,000 $ 72,000 97,000 162,500 129,000 99,000 162,500 108,250 $ 516,500 $ 441,750 Current Year $ 36,500 63,000 83,800 9,450 249,000 $ 441,750 $ 437,100 218,550 11,500 9,550 The company's income statements for the Current Year and 1 Year Ago, follow. For Year Ended December 31 Sales Cost of goods sold Other operating expenses $ 705,000 676,700 $ 28,300 $ 1.74 2 Years Ago $ 38,400 50,000 54,000 4,400 232,000 $ 378,800 For both the Current Year and 1 Year Ago, compute the following ratios: $ 51,400 83,000 162,500 81,900 $ 378,800 1 Year Ago $ 359,100 136,800 13,500 8,975 $ 570,000 518,375 $ 51,625 $ 3.18 (3-a) Compute return on total assets for the current year and one year ago. (3-b) Based on return on total assets, did Simon's operating efficiency improve or worsen in the Current Year versus 1 Year Ago?
Step by Step Solution
There are 3 Steps involved in it
Step: 1

Get Instant Access to Expert-Tailored Solutions
See step-by-step solutions with expert insights and AI powered tools for academic success
Step: 2

Step: 3
Ace Your Homework with AI
Get the answers you need in no time with our AI-driven, step-by-step assistance
Get Started
African Charter For Internal Audit Of Cooperative Governance
Authors: Donfack MEKONTCHOU ROCHE
1st Edition
6205541777, 978-6205541777