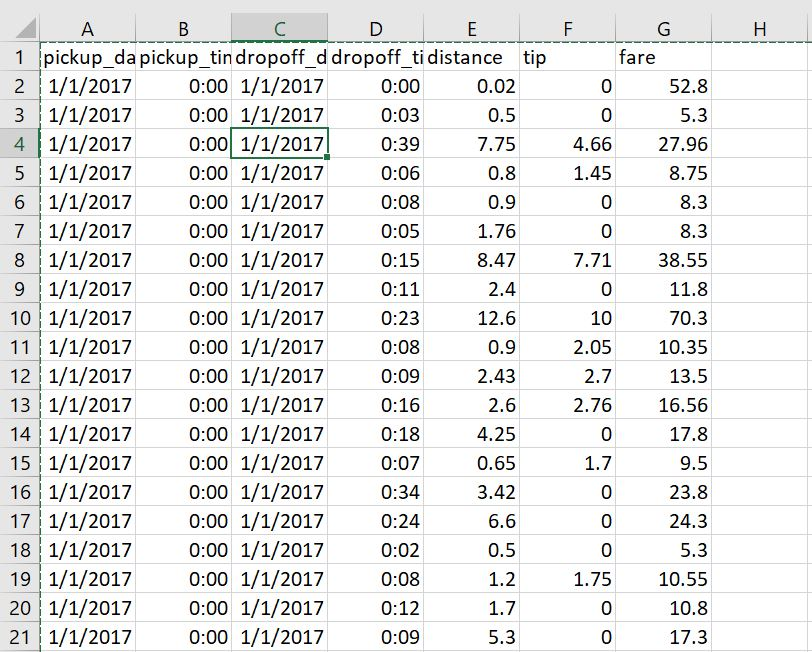
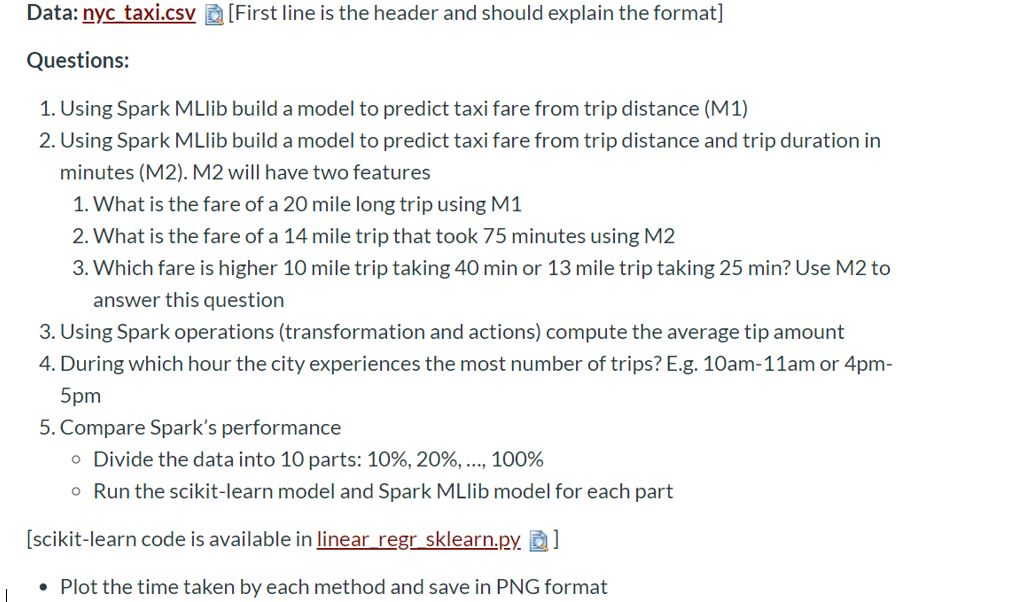
0.9 0 8.47 A B C D E 1 pickup_da pickup_tin dropoff_d dropoff_ti distance tip 2 1/1/2017 0:00 1/1/2017 0:00 0.02 3 1/1/2017 0:00 1/1/2017 0:03 0.5 4 1/1/2017 0:00 1/1/2017) 0:39 7.75 5 1/1/2017 0:00 1/1/2017 0:06 0.8 6 1/1/2017 0:00 1/1/2017 0:08 7 1/1/2017 0:00 1/1/2017 0:05 1.76 8 1/1/2017 0:00 1/1/2017 0:15 9 1/1/2017 0:00 1/1/2017 0:11 2.4 10 1/1/2017 0:00 1/1/2017 0:23 12.6 11 1/1/2017 0:00 1/1/2017 0:08 0.9 12 1/1/2017 0:00 1/1/2017 0:09 2.43 13 1/1/2017 0:00 1/1/2017 0:16 14 1/1/2017 0:00 1/1/2017 0:18 4.25 15 1/1/2017 0:00 1/1/2017 0:07 0.65 16 1/1/2017 0:00 1/1/2017 0:34 3.42 17 1/1/2017 0:00 1/1/2017 0:24 18 1/1/2017 0:00 1/1/2017 0:02 19 1/1/2017 0:00 1/1/2017 0:08 20 1/1/2017 0:00 1/1/2017 0:12 21 1/1/2017 0:00 1/1/2017 0:09 5.3 fare 0 52.8 0 5.3 4.66 27.96 1.45 8.75 0 8.3 8.3 7.71 38.55 0 11.8 10 70.3 2.05 10.35 2.7 13.5 2.76 16.56 17.8 1.7 9.5 0 23.8 24.3 5.3 1.75 10.55 0 10.8 0 17.3 2.6 0 6.6 o 0.5 1.2 1.7 Data: nyc taxi.csv (First line is the header and should explain the format] Questions: 1. Using Spark MLlib build a model to predict taxi fare from trip distance (M1) 2. Using Spark MLlib build a model to predict taxi fare from trip distance and trip duration in minutes (M2). M2 will have two features 1. What is the fare of a 20 mile long trip using M1 2. What is the fare of a 14 mile trip that took 75 minutes using M2 3. Which fare is higher 10 mile trip taking 40 min or 13 mile trip taking 25 min? Use M2 to answer this question 3. Using Spark operations (transformation and actions) compute the average tip amount 4. During which hour the city experiences the most number of trips? E.g. 10am-11am or 4pm- 5pm 5. Compare Spark's performance Divide the data into 10 parts: 10%, 20%, ..., 100% o Run the scikit-learn model and Spark MLlib model for each part [scikit-learn code is available in linear regr_sklearn.py. ] Plot the time taken by each method and save in PNG format 0.9 0 8.47 A B C D E 1 pickup_da pickup_tin dropoff_d dropoff_ti distance tip 2 1/1/2017 0:00 1/1/2017 0:00 0.02 3 1/1/2017 0:00 1/1/2017 0:03 0.5 4 1/1/2017 0:00 1/1/2017) 0:39 7.75 5 1/1/2017 0:00 1/1/2017 0:06 0.8 6 1/1/2017 0:00 1/1/2017 0:08 7 1/1/2017 0:00 1/1/2017 0:05 1.76 8 1/1/2017 0:00 1/1/2017 0:15 9 1/1/2017 0:00 1/1/2017 0:11 2.4 10 1/1/2017 0:00 1/1/2017 0:23 12.6 11 1/1/2017 0:00 1/1/2017 0:08 0.9 12 1/1/2017 0:00 1/1/2017 0:09 2.43 13 1/1/2017 0:00 1/1/2017 0:16 14 1/1/2017 0:00 1/1/2017 0:18 4.25 15 1/1/2017 0:00 1/1/2017 0:07 0.65 16 1/1/2017 0:00 1/1/2017 0:34 3.42 17 1/1/2017 0:00 1/1/2017 0:24 18 1/1/2017 0:00 1/1/2017 0:02 19 1/1/2017 0:00 1/1/2017 0:08 20 1/1/2017 0:00 1/1/2017 0:12 21 1/1/2017 0:00 1/1/2017 0:09 5.3 fare 0 52.8 0 5.3 4.66 27.96 1.45 8.75 0 8.3 8.3 7.71 38.55 0 11.8 10 70.3 2.05 10.35 2.7 13.5 2.76 16.56 17.8 1.7 9.5 0 23.8 24.3 5.3 1.75 10.55 0 10.8 0 17.3 2.6 0 6.6 o 0.5 1.2 1.7 Data: nyc taxi.csv (First line is the header and should explain the format] Questions: 1. Using Spark MLlib build a model to predict taxi fare from trip distance (M1) 2. Using Spark MLlib build a model to predict taxi fare from trip distance and trip duration in minutes (M2). M2 will have two features 1. What is the fare of a 20 mile long trip using M1 2. What is the fare of a 14 mile trip that took 75 minutes using M2 3. Which fare is higher 10 mile trip taking 40 min or 13 mile trip taking 25 min? Use M2 to answer this question 3. Using Spark operations (transformation and actions) compute the average tip amount 4. During which hour the city experiences the most number of trips? E.g. 10am-11am or 4pm- 5pm 5. Compare Spark's performance Divide the data into 10 parts: 10%, 20%, ..., 100% o Run the scikit-learn model and Spark MLlib model for each part [scikit-learn code is available in linear regr_sklearn.py. ] Plot the time taken by each method and save in PNG format