Answered step by step
Verified Expert Solution
Question
1 Approved Answer
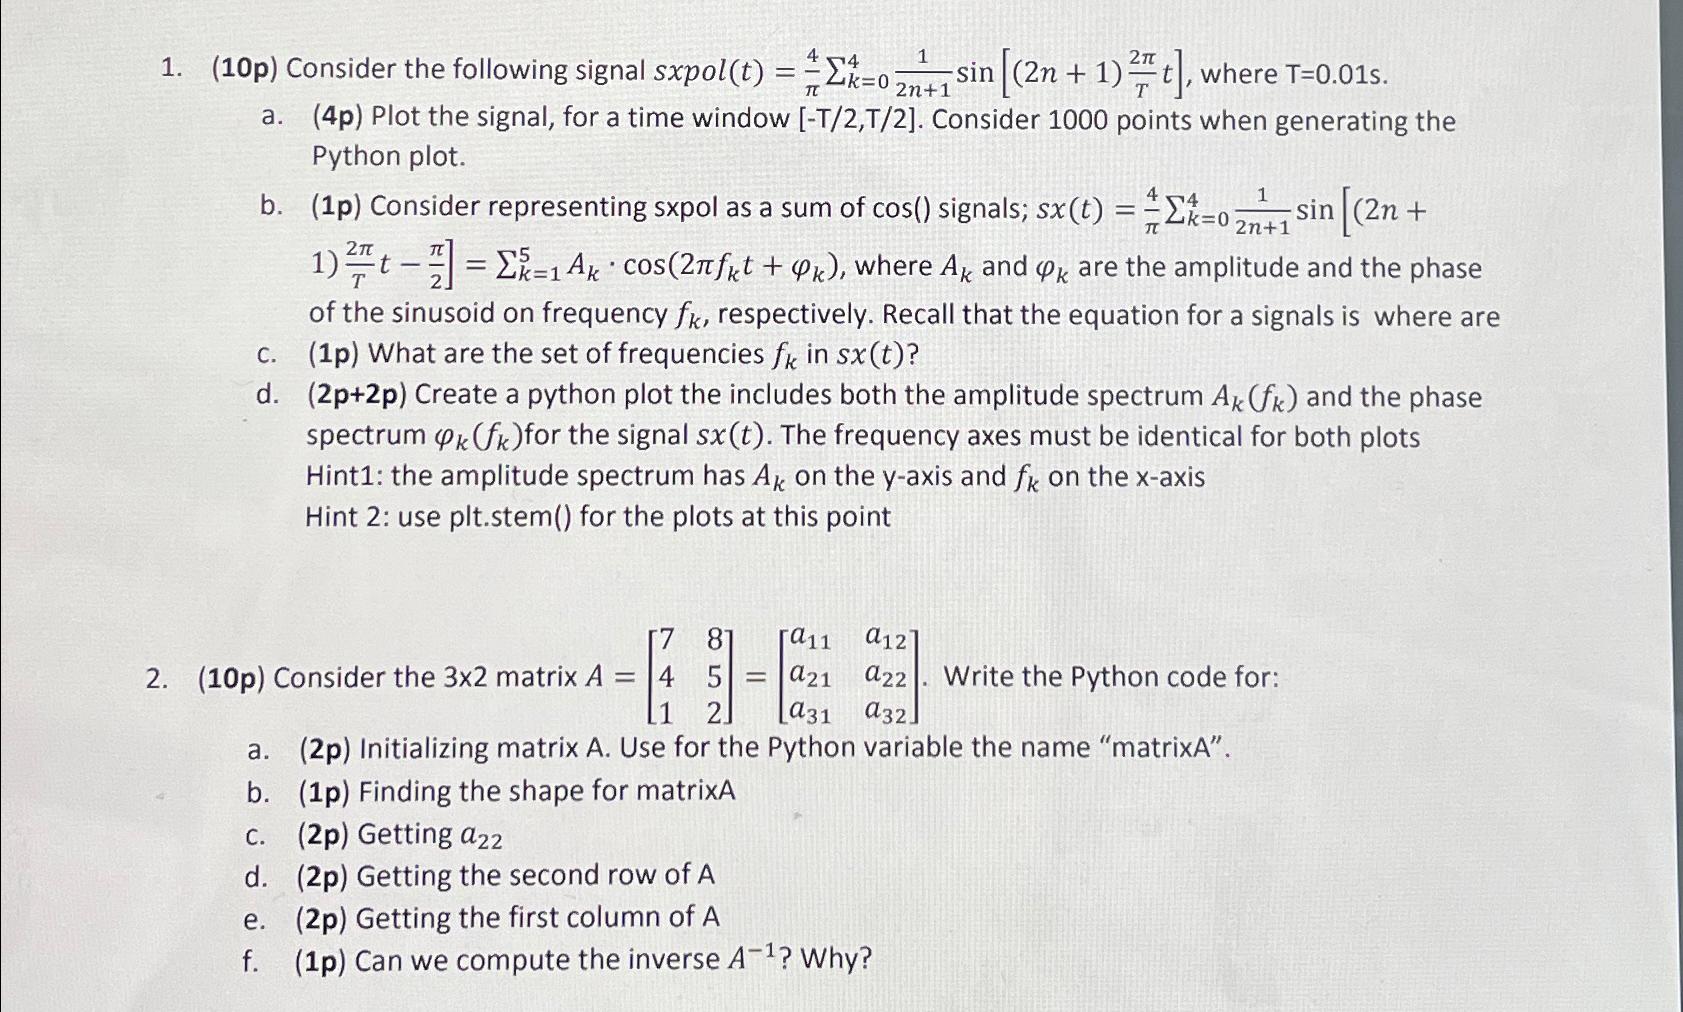
( 1 0 p ) Consider the following signal sxpol ( t ) = 4 k = 0 4 1 2 n + 1 s
p Consider the following signal sxpol where
ap Plot the signal, for a time window Consider points when generating the Python plot.
bp Consider representing sxpol as a sum of signals; : where and are the amplitude and the phase of the sinusoid on frequency respectively. Recall that the equation for a signals is where are
cp What are the set of frequencies in
d Create a python plot the includes both the amplitude spectrum and the phase spectrum for the signal The frequency axes must be identical for both plots Hint: the amplitude spectrum has on the axis and on the xaxis Hint : use pltstem for the plots at this point
p Consider the matrix Write the Python code for:
ap Initializing matrix A Use for the Python variable the name "matrixA".
bp Finding the shape for matrixA
cp Getting
dp Getting the second row of
ep Getting the first column of A
fp Can we compute the inverse Why?

Step by Step Solution
There are 3 Steps involved in it
Step: 1

Get Instant Access to Expert-Tailored Solutions
See step-by-step solutions with expert insights and AI powered tools for academic success
Step: 2

Step: 3

Ace Your Homework with AI
Get the answers you need in no time with our AI-driven, step-by-step assistance
Get Started


