

Answered step by step
Verified Expert Solution
Question
1 Approved Answer
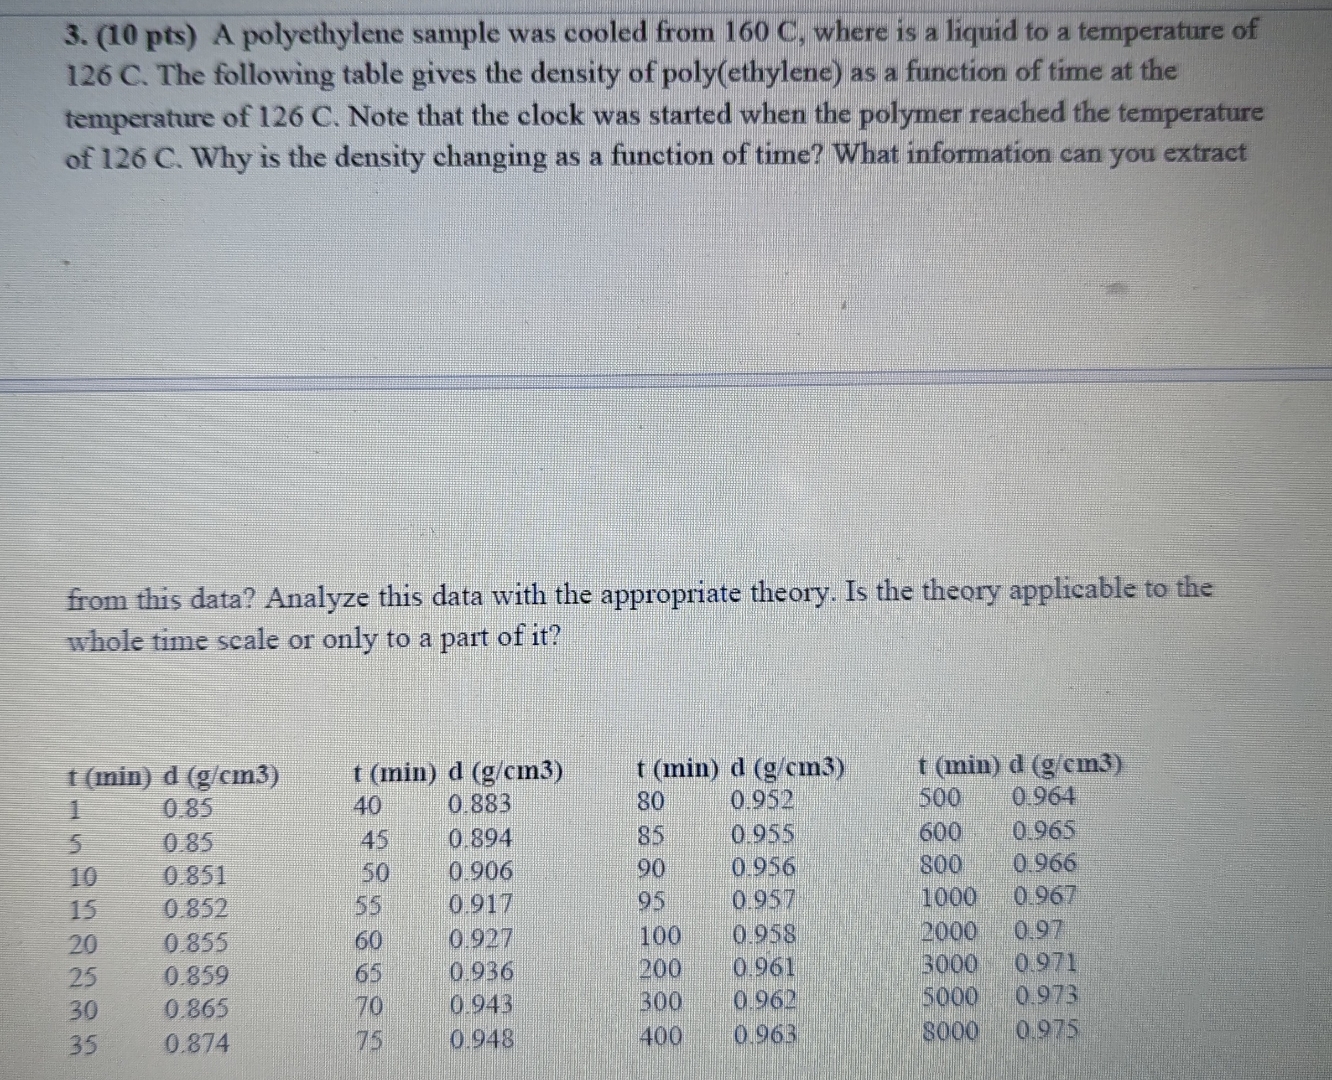
( 1 0 p t s ) A polyethylene sample was cooled from 1 6 0 C , where is a liquid to a temperature
A polyethylene sample was cooled from where is a liquid to a temperature of The following table gives the density of polyethylene as a function of time at the temperature of Note that the clock was started when the polymer reached the temperature of Why is the density changing as a function of time? What information can you extract
from this data? Analyze this data with the appropriate theory. Is the theory applicable to the whole time scale or only to a part of it
table
Step by Step Solution
There are 3 Steps involved in it
Step: 1

Get Instant Access to Expert-Tailored Solutions
See step-by-step solutions with expert insights and AI powered tools for academic success
Step: 2

Step: 3
Ace Your Homework with AI
Get the answers you need in no time with our AI-driven, step-by-step assistance
Get Started
Introduction To Chemical Engineering Thermodynamics
Authors: J.M. Smith, Hendrick Van Ness, Michael Abbott, Mark Swihart
9th Edition
1260721477, 978-1260721478