Answered step by step
Verified Expert Solution
Question
1 Approved Answer
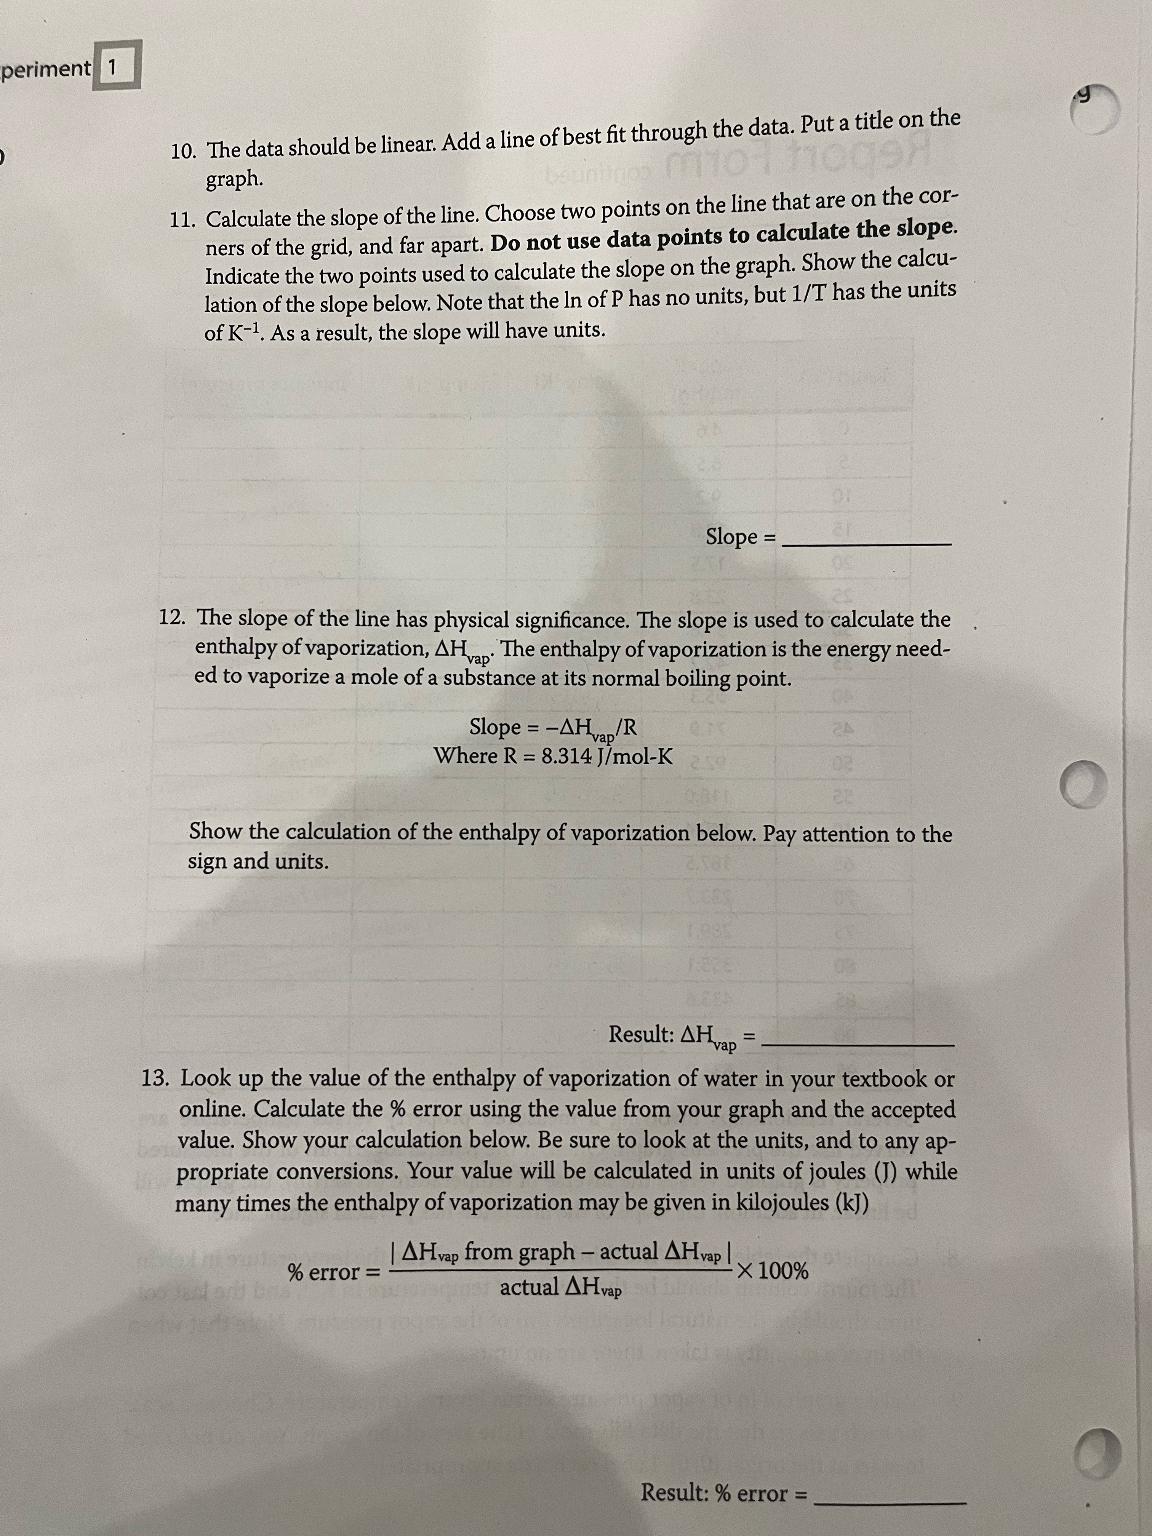
1 1 0 . The data should be linear. Add a line of best fit through the data. Put a title on the graph. 1
The data should be linear. Add a line of best fit through the data. Put a title on the graph.
Calculate the slope of the line. Choose two points on the line that are on the corners of the grid, and far apart. Do not use data points to calculate the slope. Indicate the two points used to calculate the slope on the graph. Show the calculation of the slope below. Note that the of has no units, but has the units of As a result, the slope will have units.
Slope
The slope of the line has physical significance. The slope is used to calculate the enthalpy of vaporization, The enthalpy of vaporization is the energy needed to vaporize a mole of a substance at its normal boiling point.
Slope
Where
Show the calculation of the enthalpy of vaporization below. Pay attention to the sign and units.
Result:
Look up the value of the enthalpy of vaporization of water in your textbook or online. Calculate the error using the value from your graph and the accepted value. Show your calculation below. Be sure to look at the units, and to any appropriate conversions. Your value will be calculated in units of joules while many times the enthalpy of vaporization may be given in kilojoules
error
Result: error

Step by Step Solution
There are 3 Steps involved in it
Step: 1

Get Instant Access to Expert-Tailored Solutions
See step-by-step solutions with expert insights and AI powered tools for academic success
Step: 2

Step: 3

Ace Your Homework with AI
Get the answers you need in no time with our AI-driven, step-by-step assistance
Get Started


