1. 1. In a game of chance, we spin a wheel that has 10 equal spaces numbered 1 through 10. If a 1 ,2, or
1. 1. In a game of chance, we spin a wheel that has 10 equal spaces numbered 1 through 10. If a 1 ,2, or a 3 comes up we lose $20 and if a 4,5,6 or 7 comes up we win $17. If we get an 8 we lose $45 and a 9 or 10 we win $26. If W is the random variable that denotes your winnings for one play of the game find the probability distribution for W(show all work here)
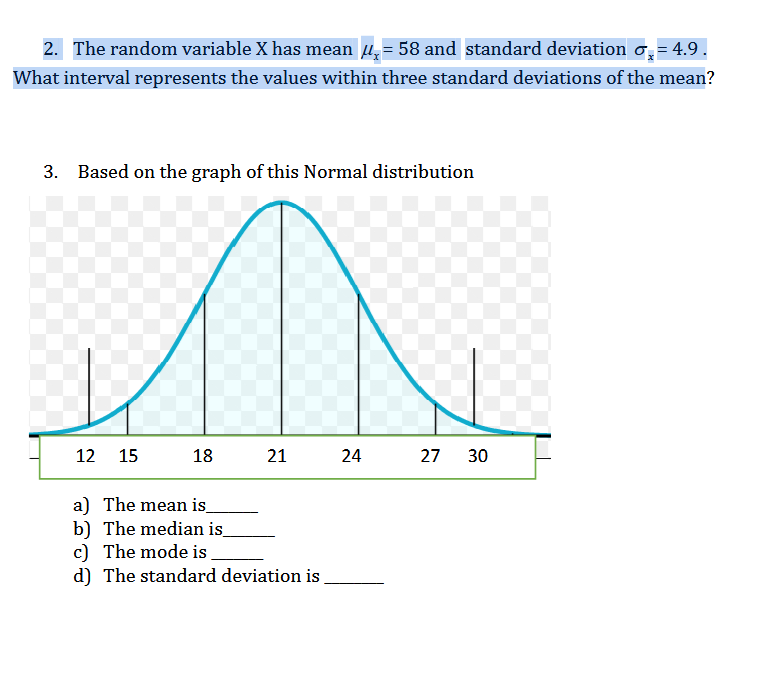
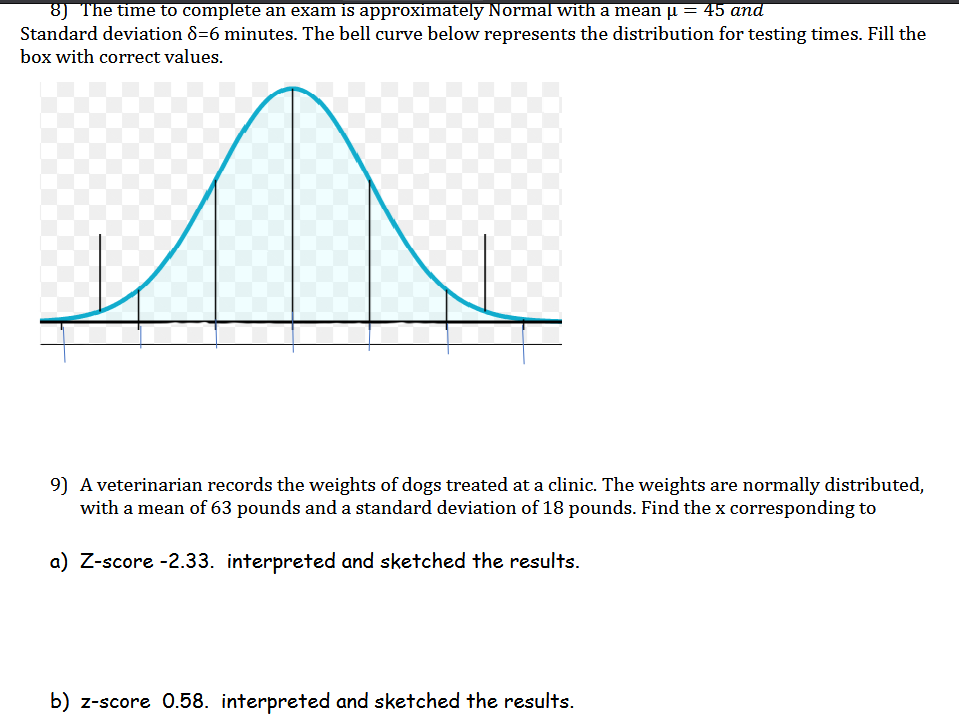
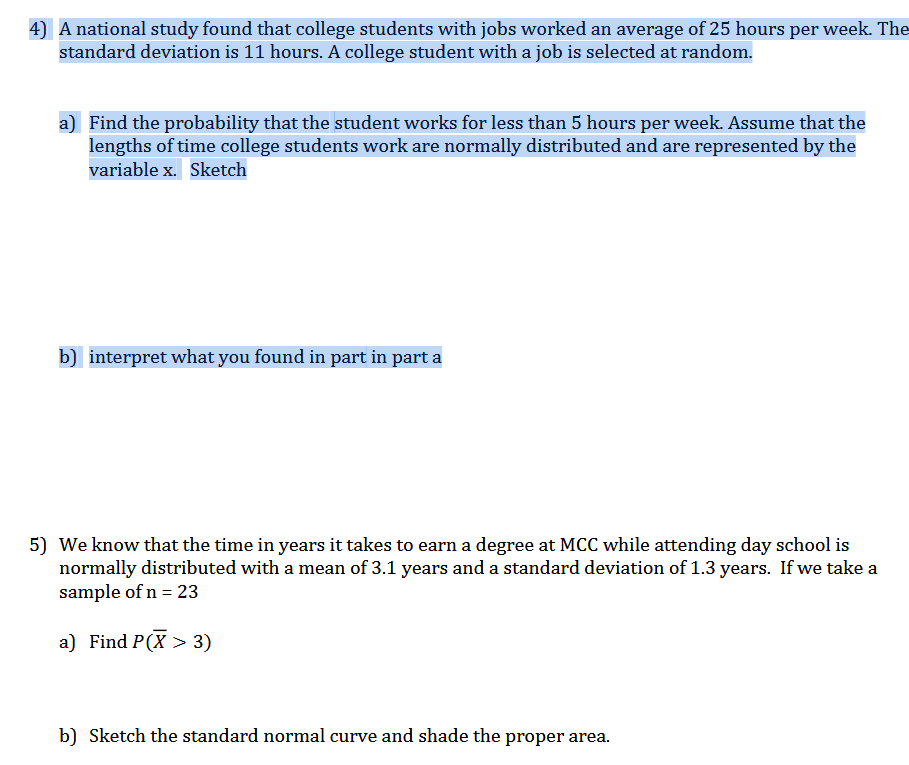
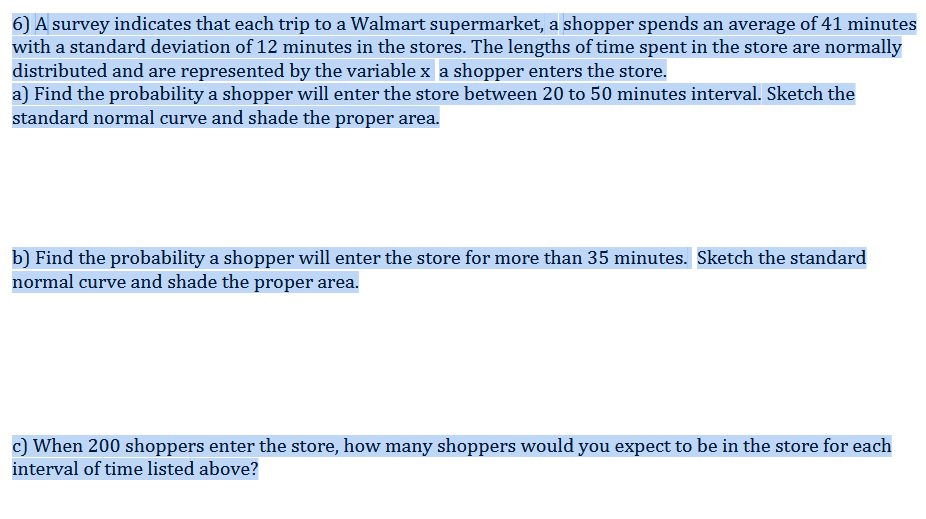
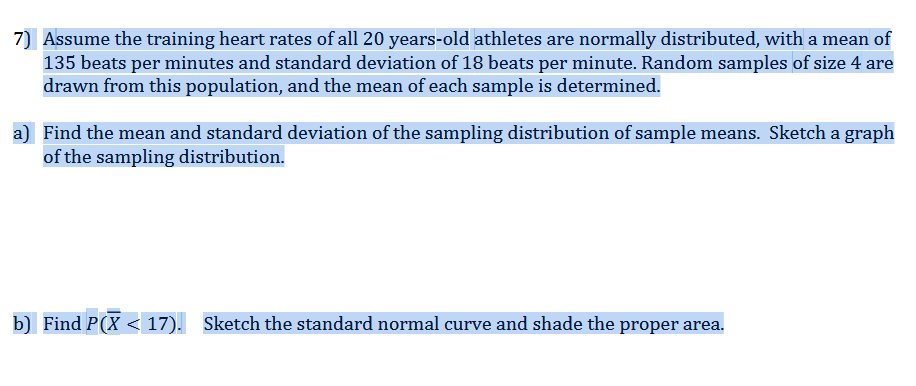
2. The random variable X has mean , = 58 and standard deviation G, = 4.9. What interval represents the values within three standard deviations of the mean? 3. Based on the graph of this Normal distribution 12 15 18 21 24 27 30 a) The mean is. b) The median is. c) The mode is d) The standard deviation ise time to complete an exam 1s approximately Normal with a mean p = 45 an Standard deviation =6 minutes. The bell curve below represents the distribution for testing times. Fill the box with correct values. 9) A veterinarian records the weights of dogs treated at a clinic. The weights are normally distributed, with a mean of 63 pounds and a standard deviation of 18 pounds. Find the x corresponding to a) Z-score -2.33. interpreted and sketched the results. b) z-score 0.58. interpreted and sketched the results. 4) A national study found that college students with jobs worked an average of 25 hours per week. The standard deviation is 11 hours. A college student with a job is selected at random. a) Find the probability that the student works for less than 5 hours per week. Assume that the lengths of time college students work are normally distributed and are represented by the variable x. Sketch b) interpret what you found in part in part a 5) We know that the time in years it takes to earn a degree at MCC while attending day school is normally distributed with a mean of 3.1 years and a standard deviation of 1.3 years. If we take a sample of n = 23 a) Find P(X > 3) b) Sketch the standard normal curve and shade the proper area. 6) A survey indicates that each trip to a Walmart supermarket, a shopper spends an average of 41 minutes with a standard deviation of 12 minutes in the stores. The lengths of time spent in the store are normally distributed and are represented by the variable x a shopper enters the store. a) Find the probability a shopper will enter the store between 20 to 50 minutes interval. Sketch the standard normal curve and shade the proper area. b) Find the probability a shopper will enter the store for more than 35 minutes. Sketch the standard normal curve and shade the proper area. c) When 200 shoppers enter the store, how many shoppers would you expect to be in the store for each interval of time listed above? 7) a) b) Assume the training heart rates of all 20 years-old athletes are normally distributed, with a mean of 135 beats per minutes and standard deviation of 18 beats per minute. Random samples of size 4 are drawn from this population, and the mean of each sample is determined. Find the mean and standard deviation of the sampling distribution of sample means. Sketch a graph of the sampling distribution. Find P(E <. sketch the standard normal curve and shade proper area>
Step by Step Solution
There are 3 Steps involved in it
Step: 1
Get Instant Access to Expert-Tailored Solutions
See step-by-step solutions with expert insights and AI powered tools for academic success
Step: 2
Step: 3
Ace Your Homework with AI
Get the answers you need in no time with our AI-driven, step-by-step assistance