p2L Module 1 Assignment - CSC X D2l Module 1 Assignment - CSCZ X o (6 25 nationalu.brightspace.com/d2l/Ims/dropbox/user/folder_submit_files.d2I?ou=81515&isprv=0&db=438645&cfql=1 Instructions Use MS Excel or Google Sheets
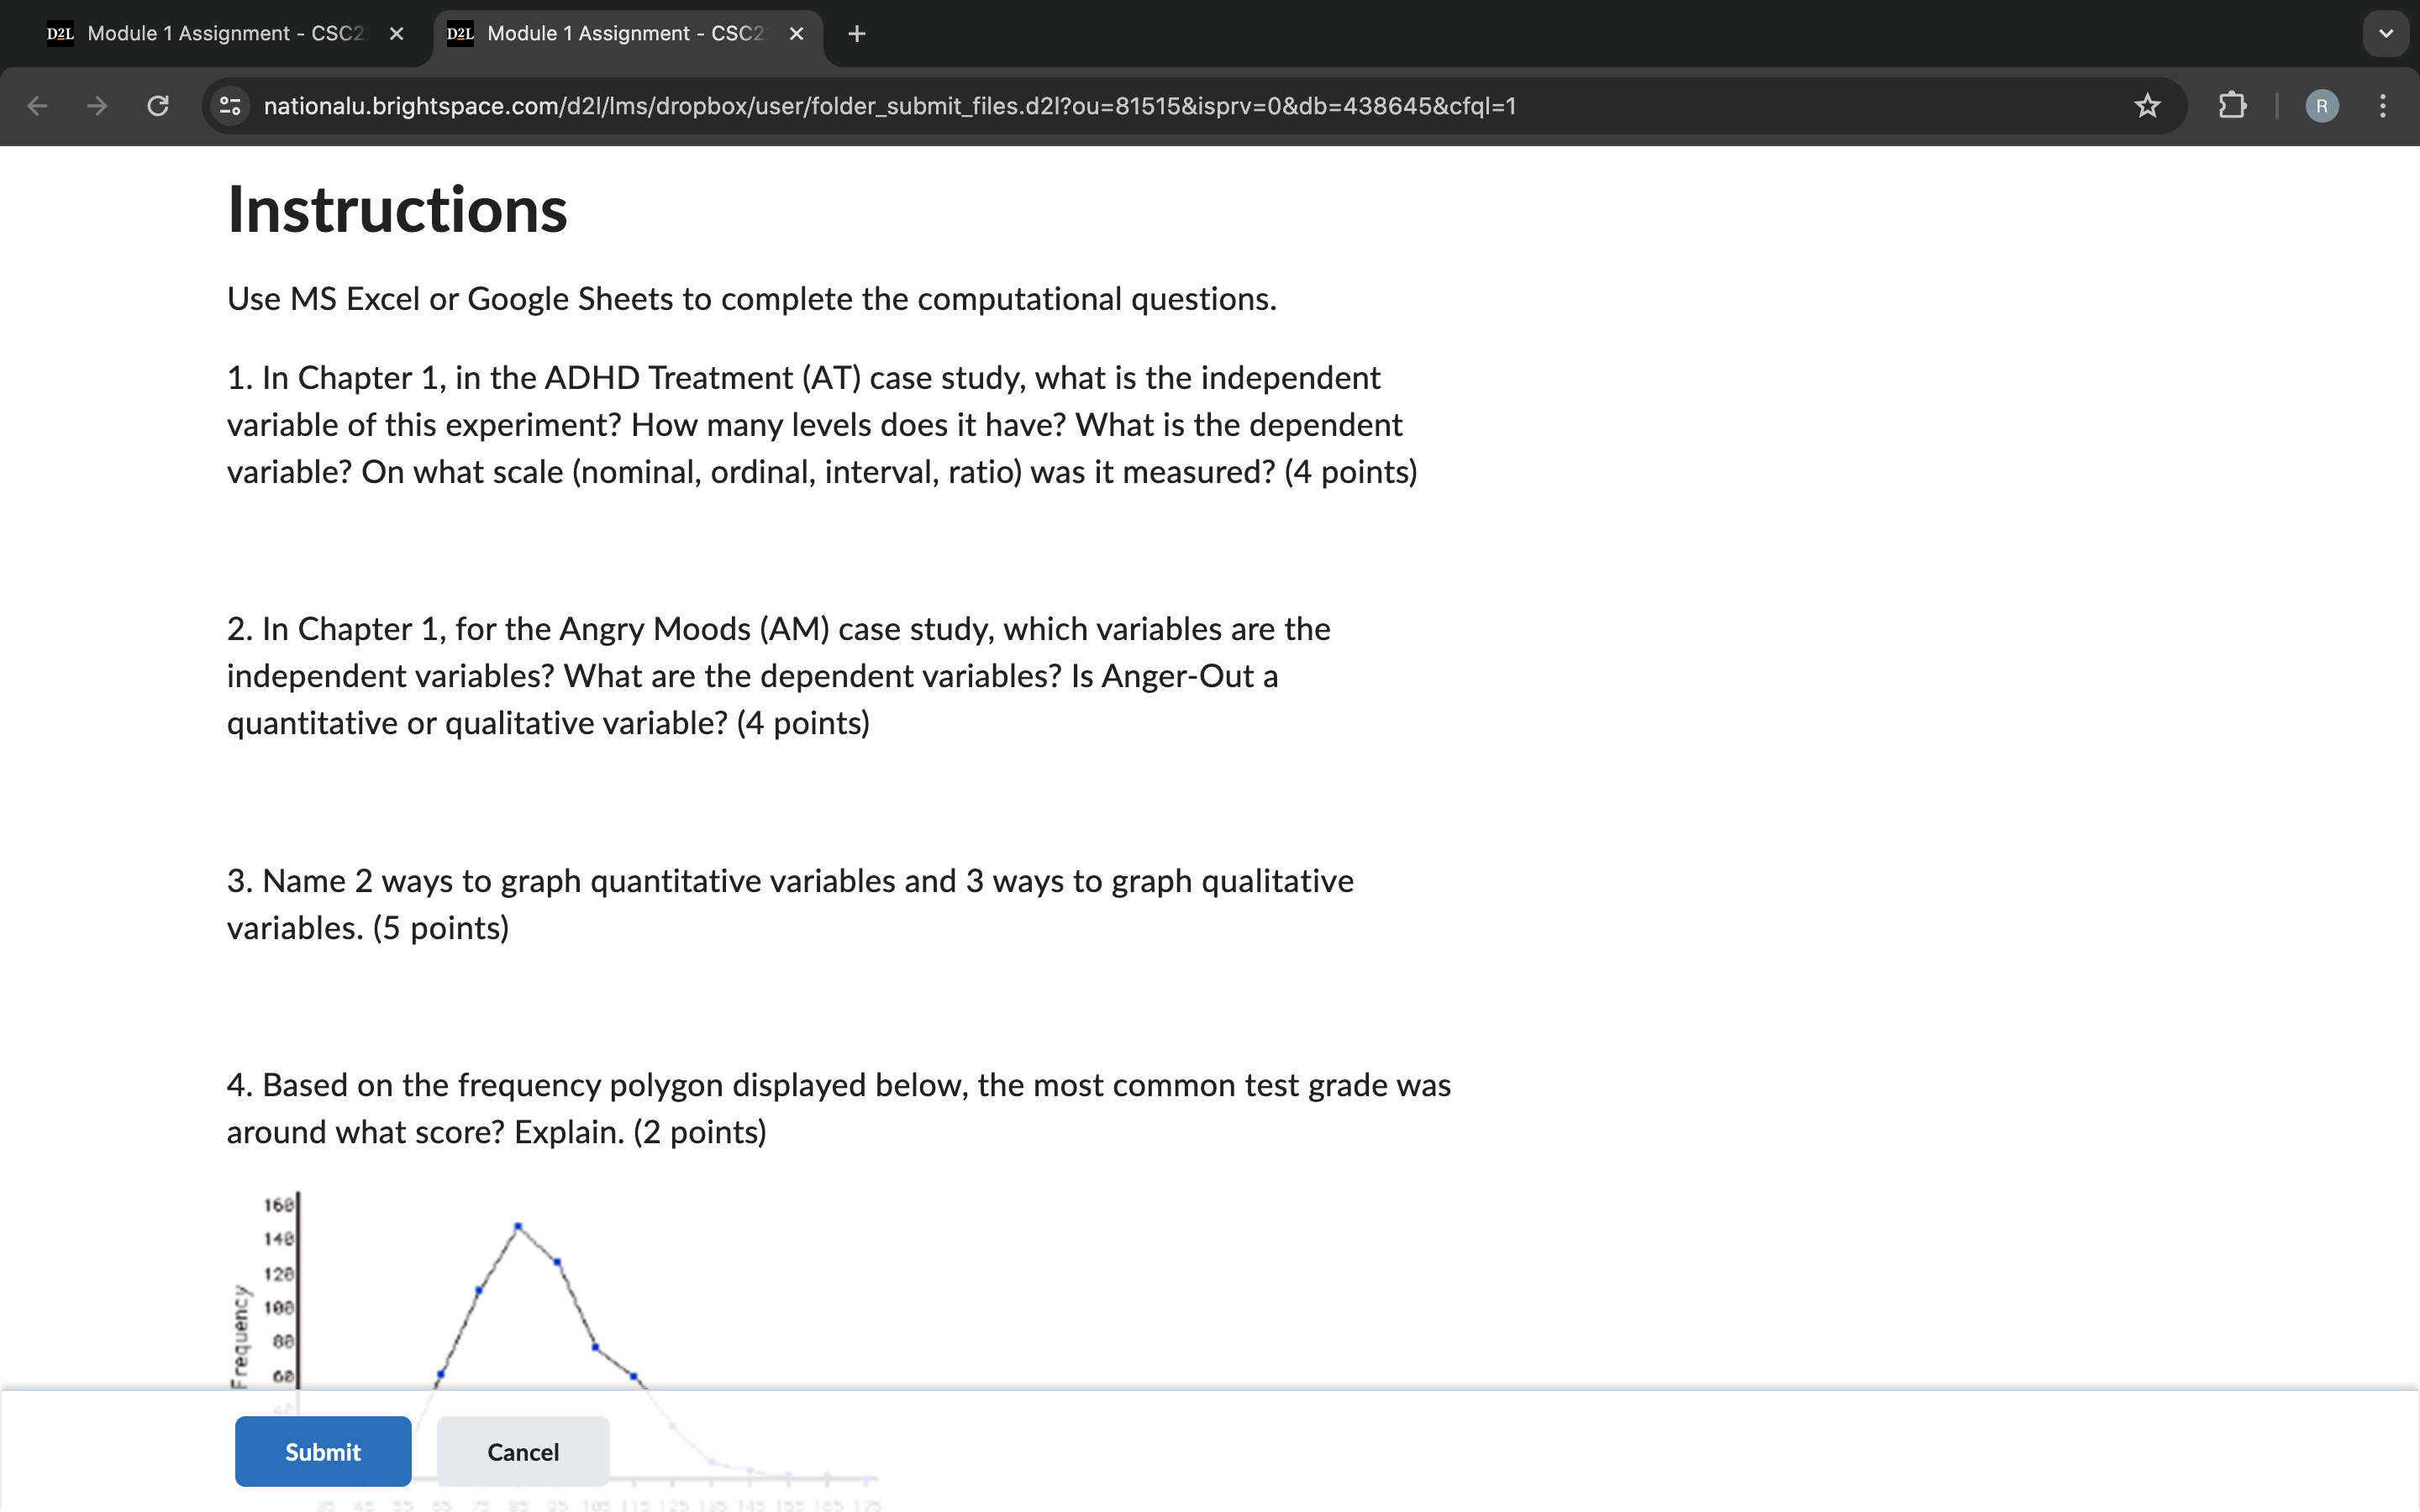
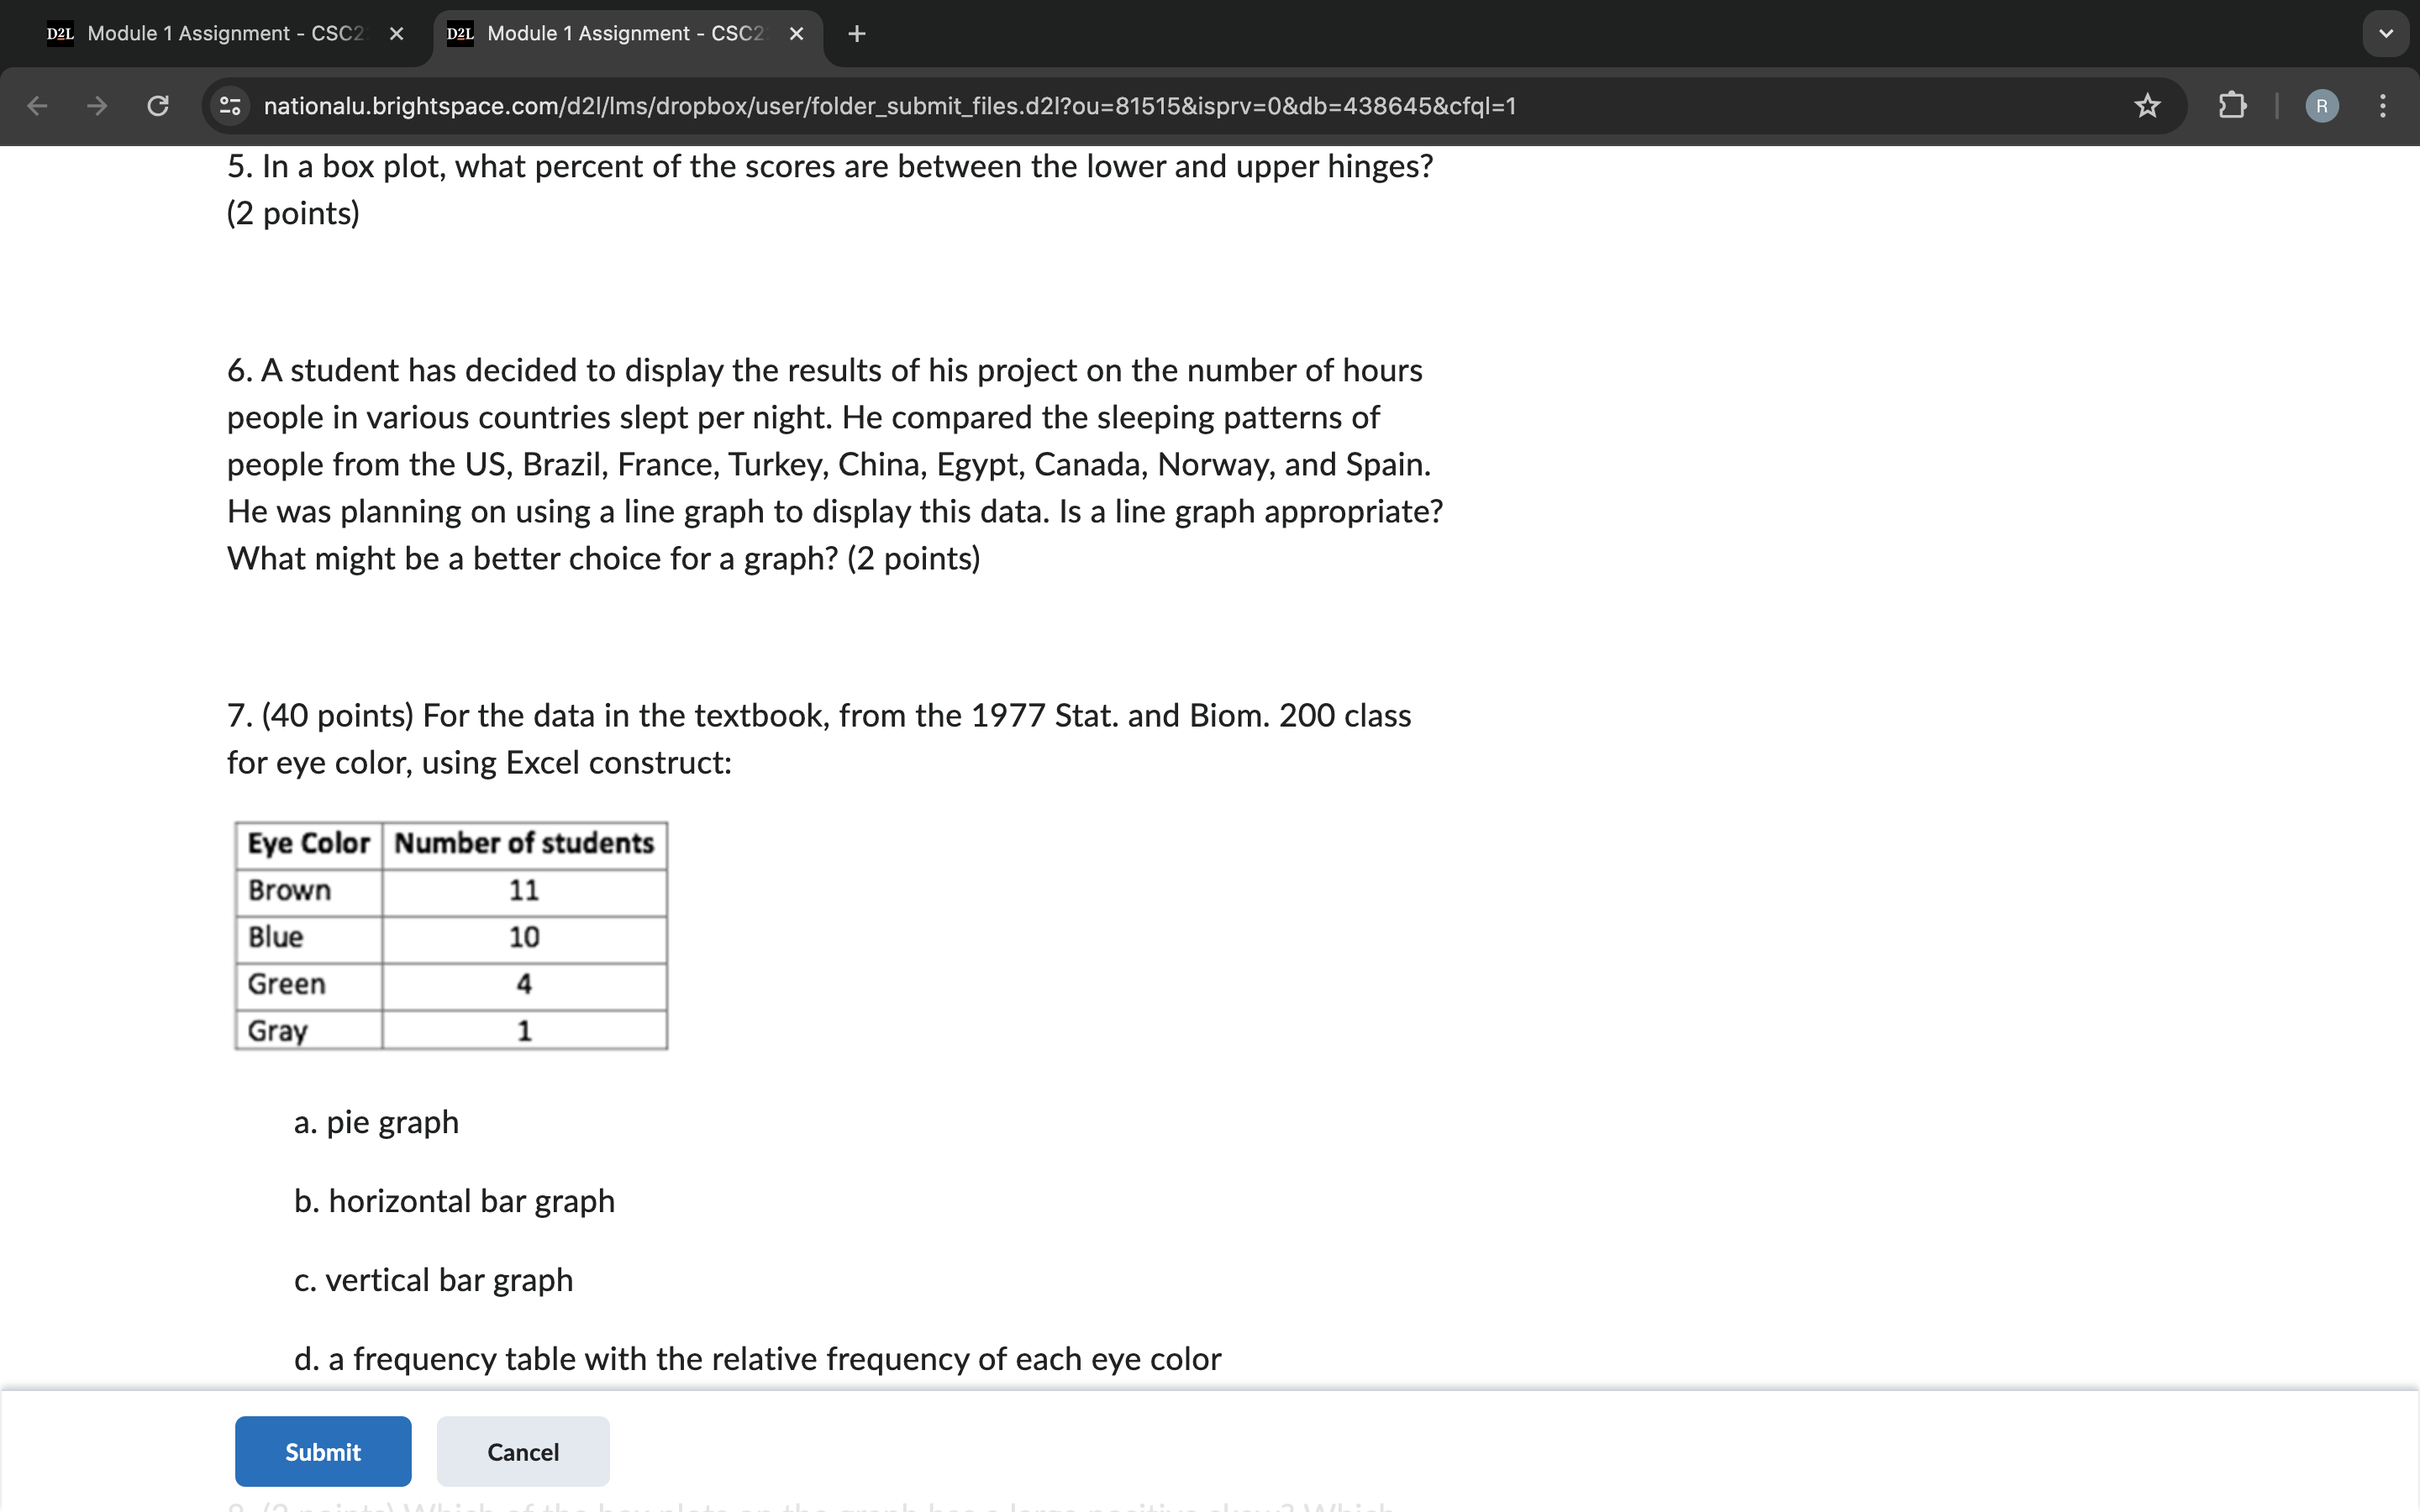
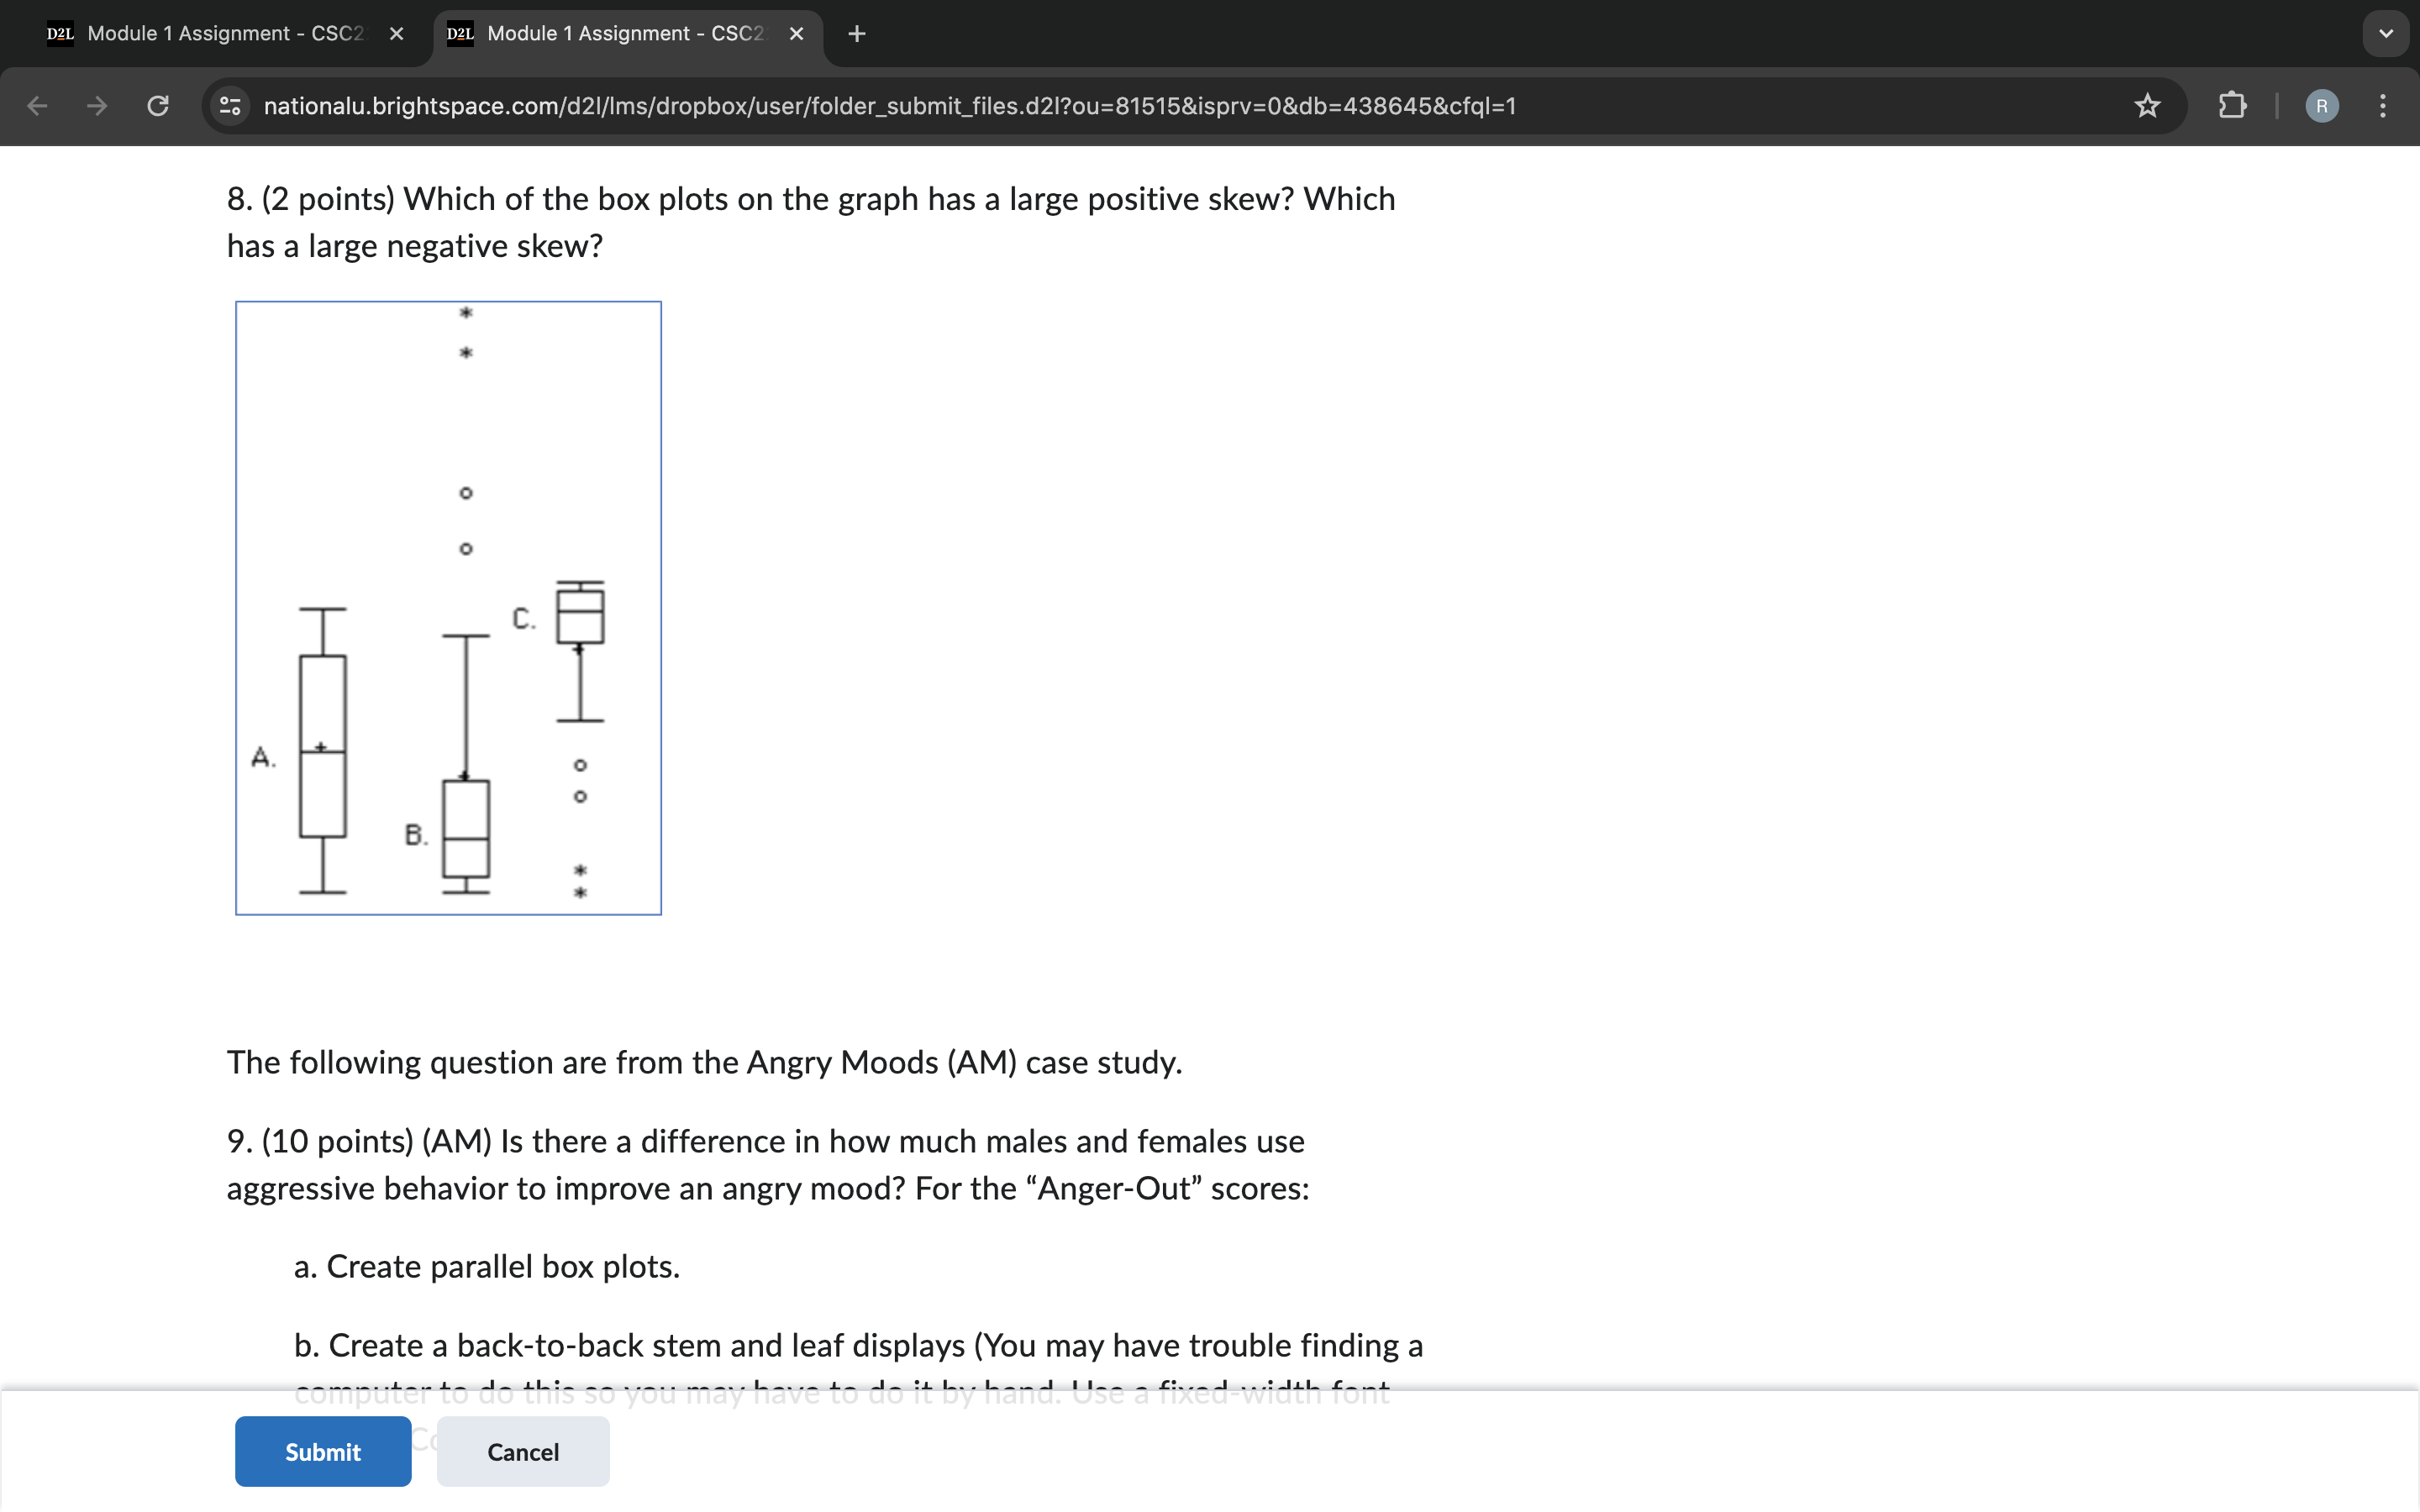
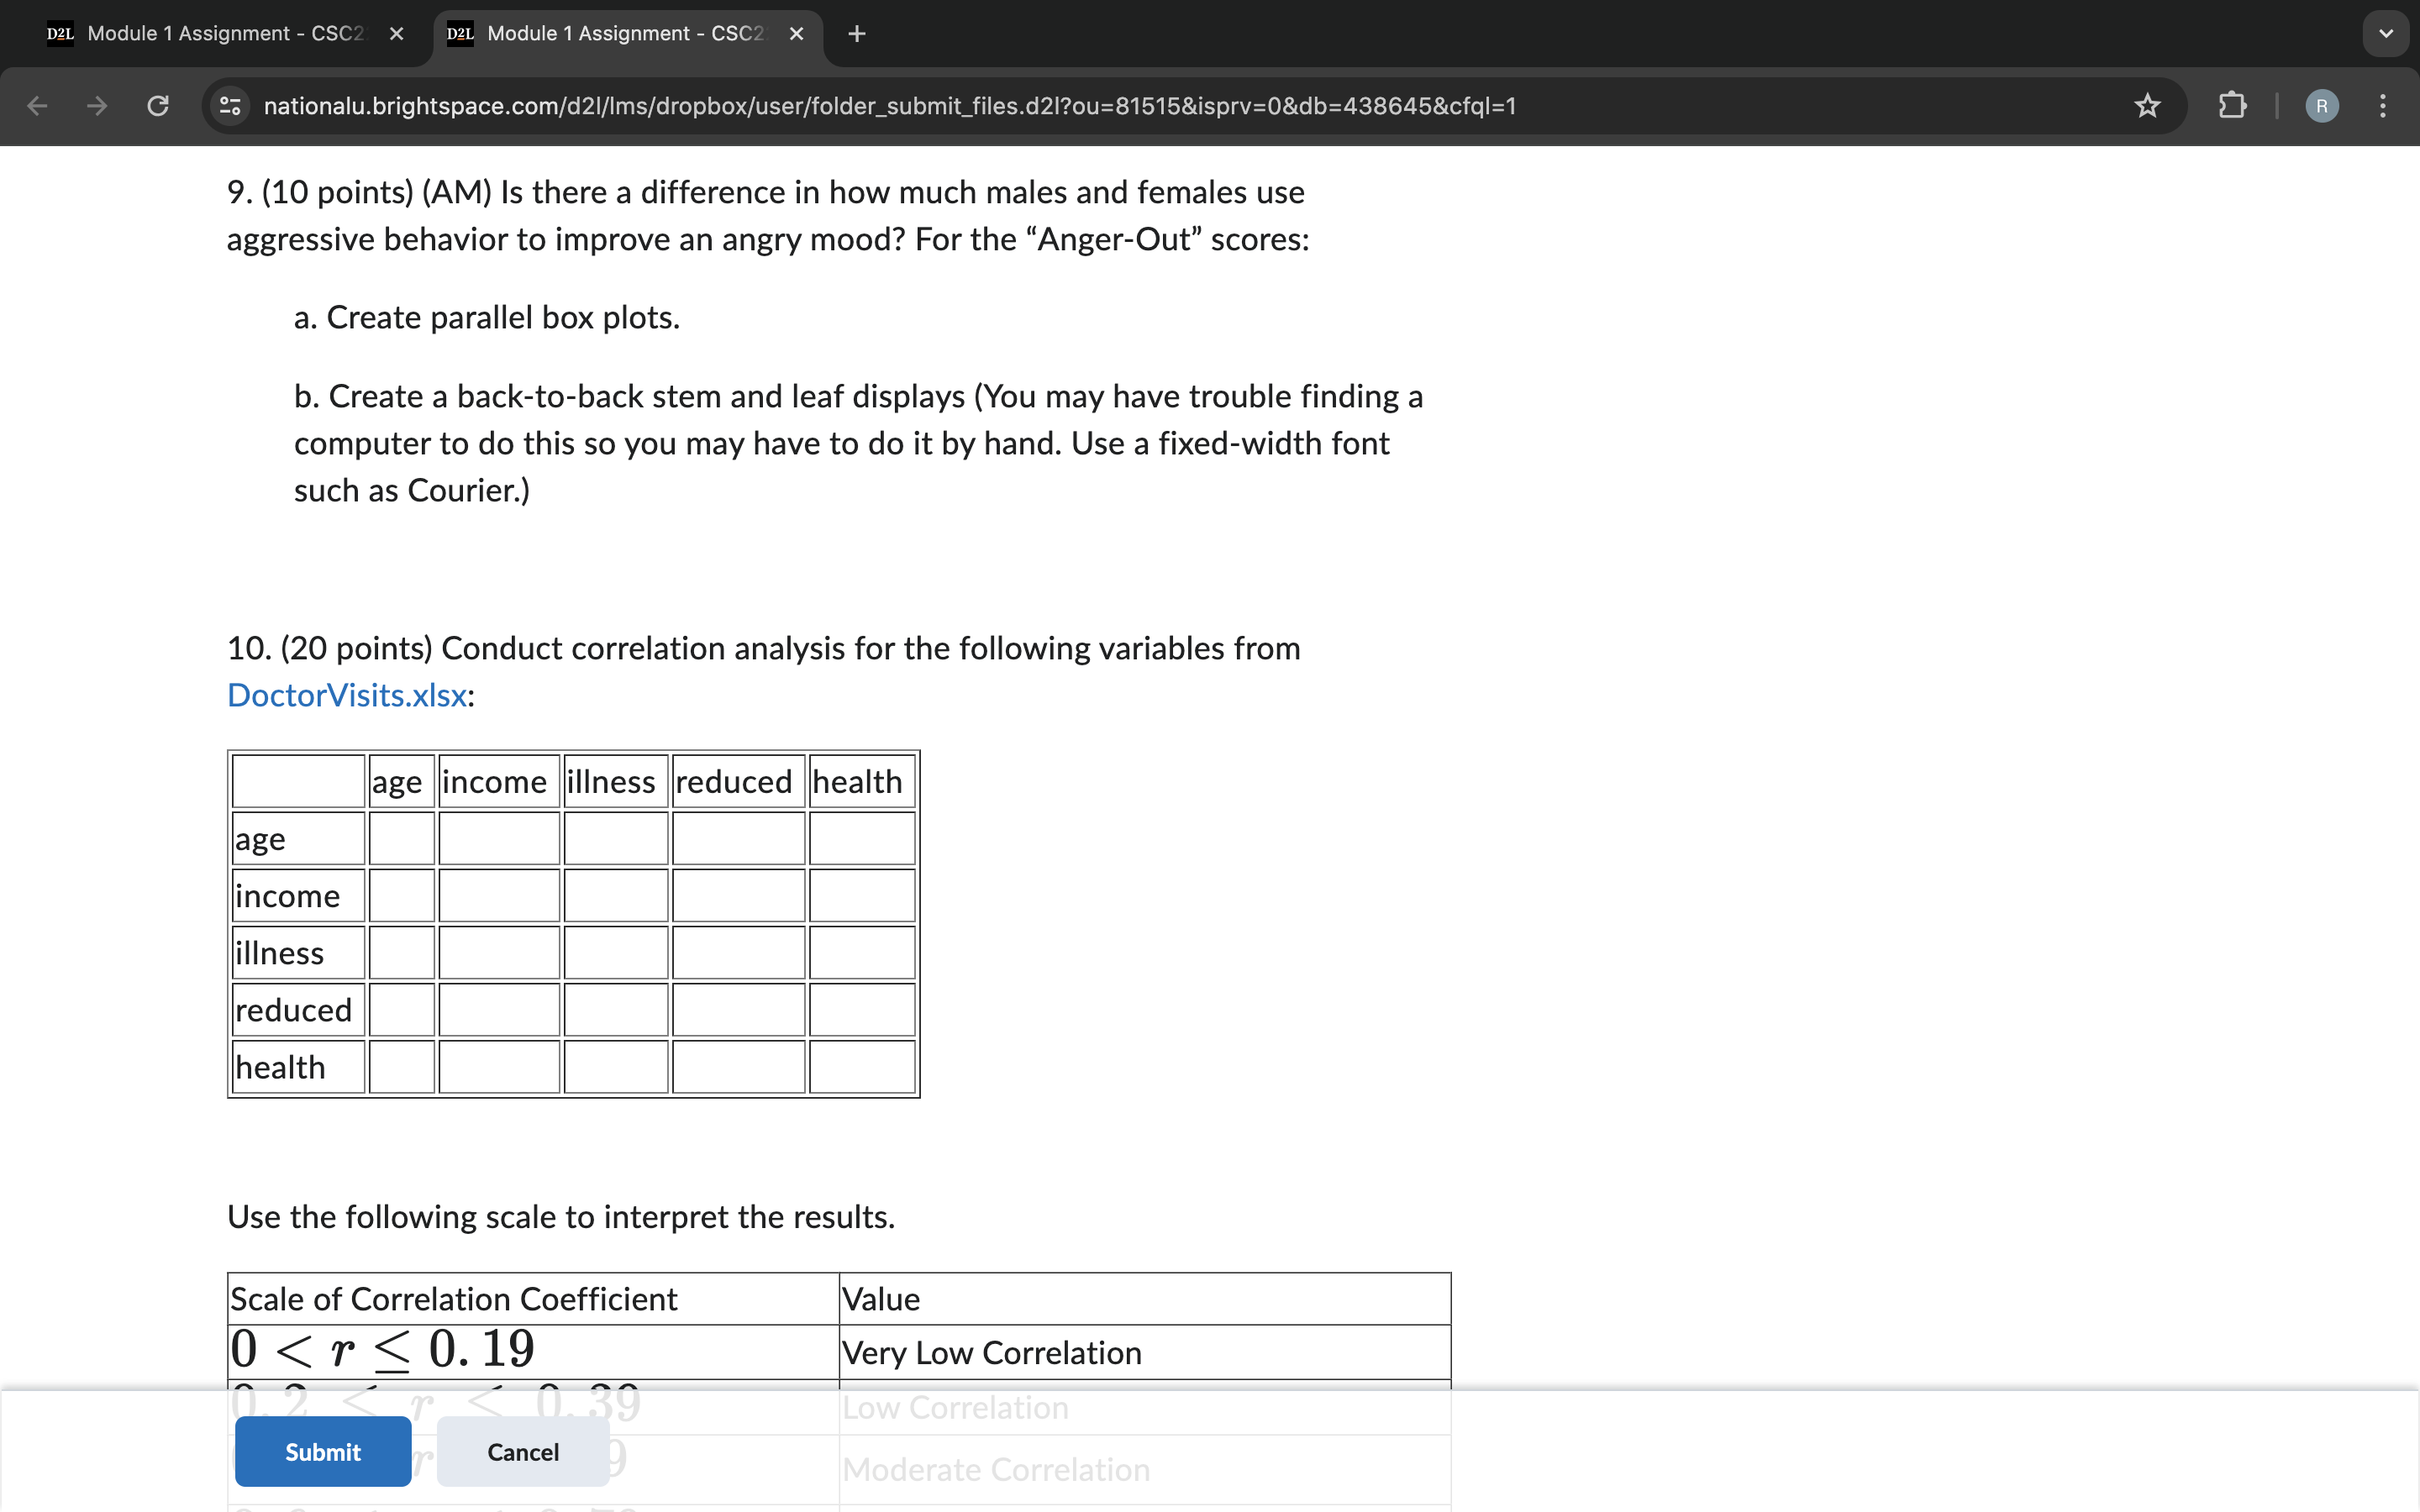
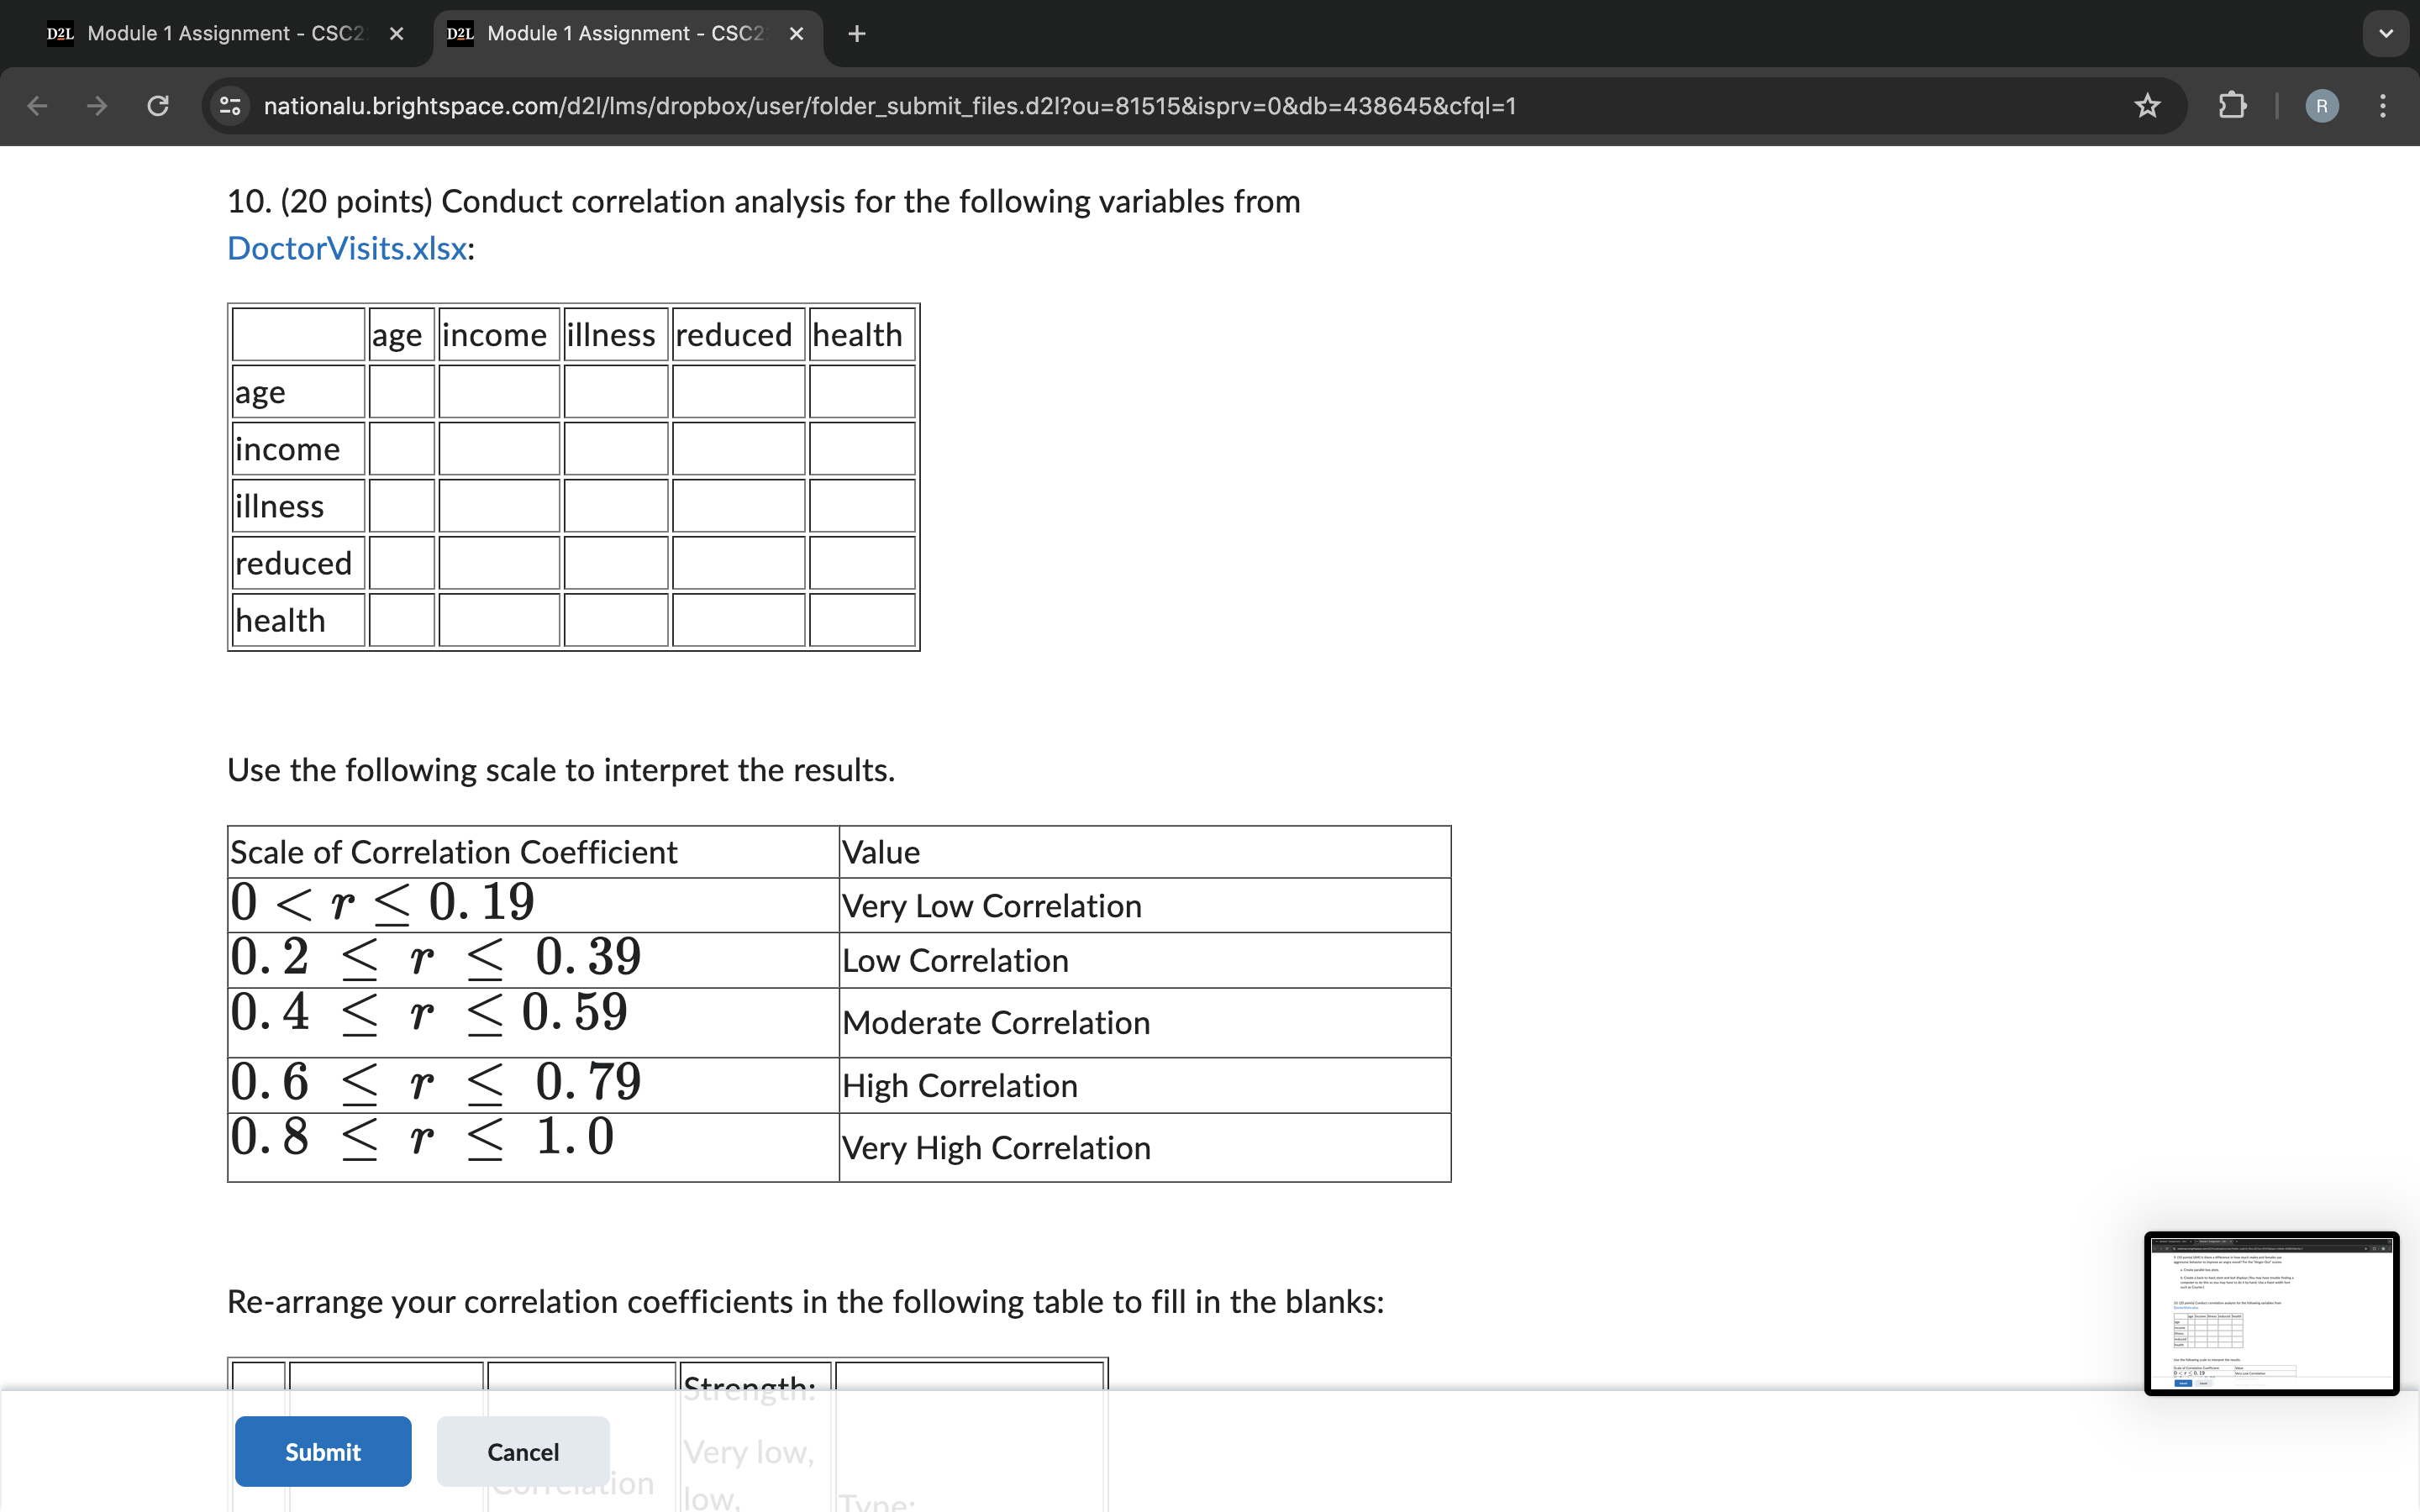
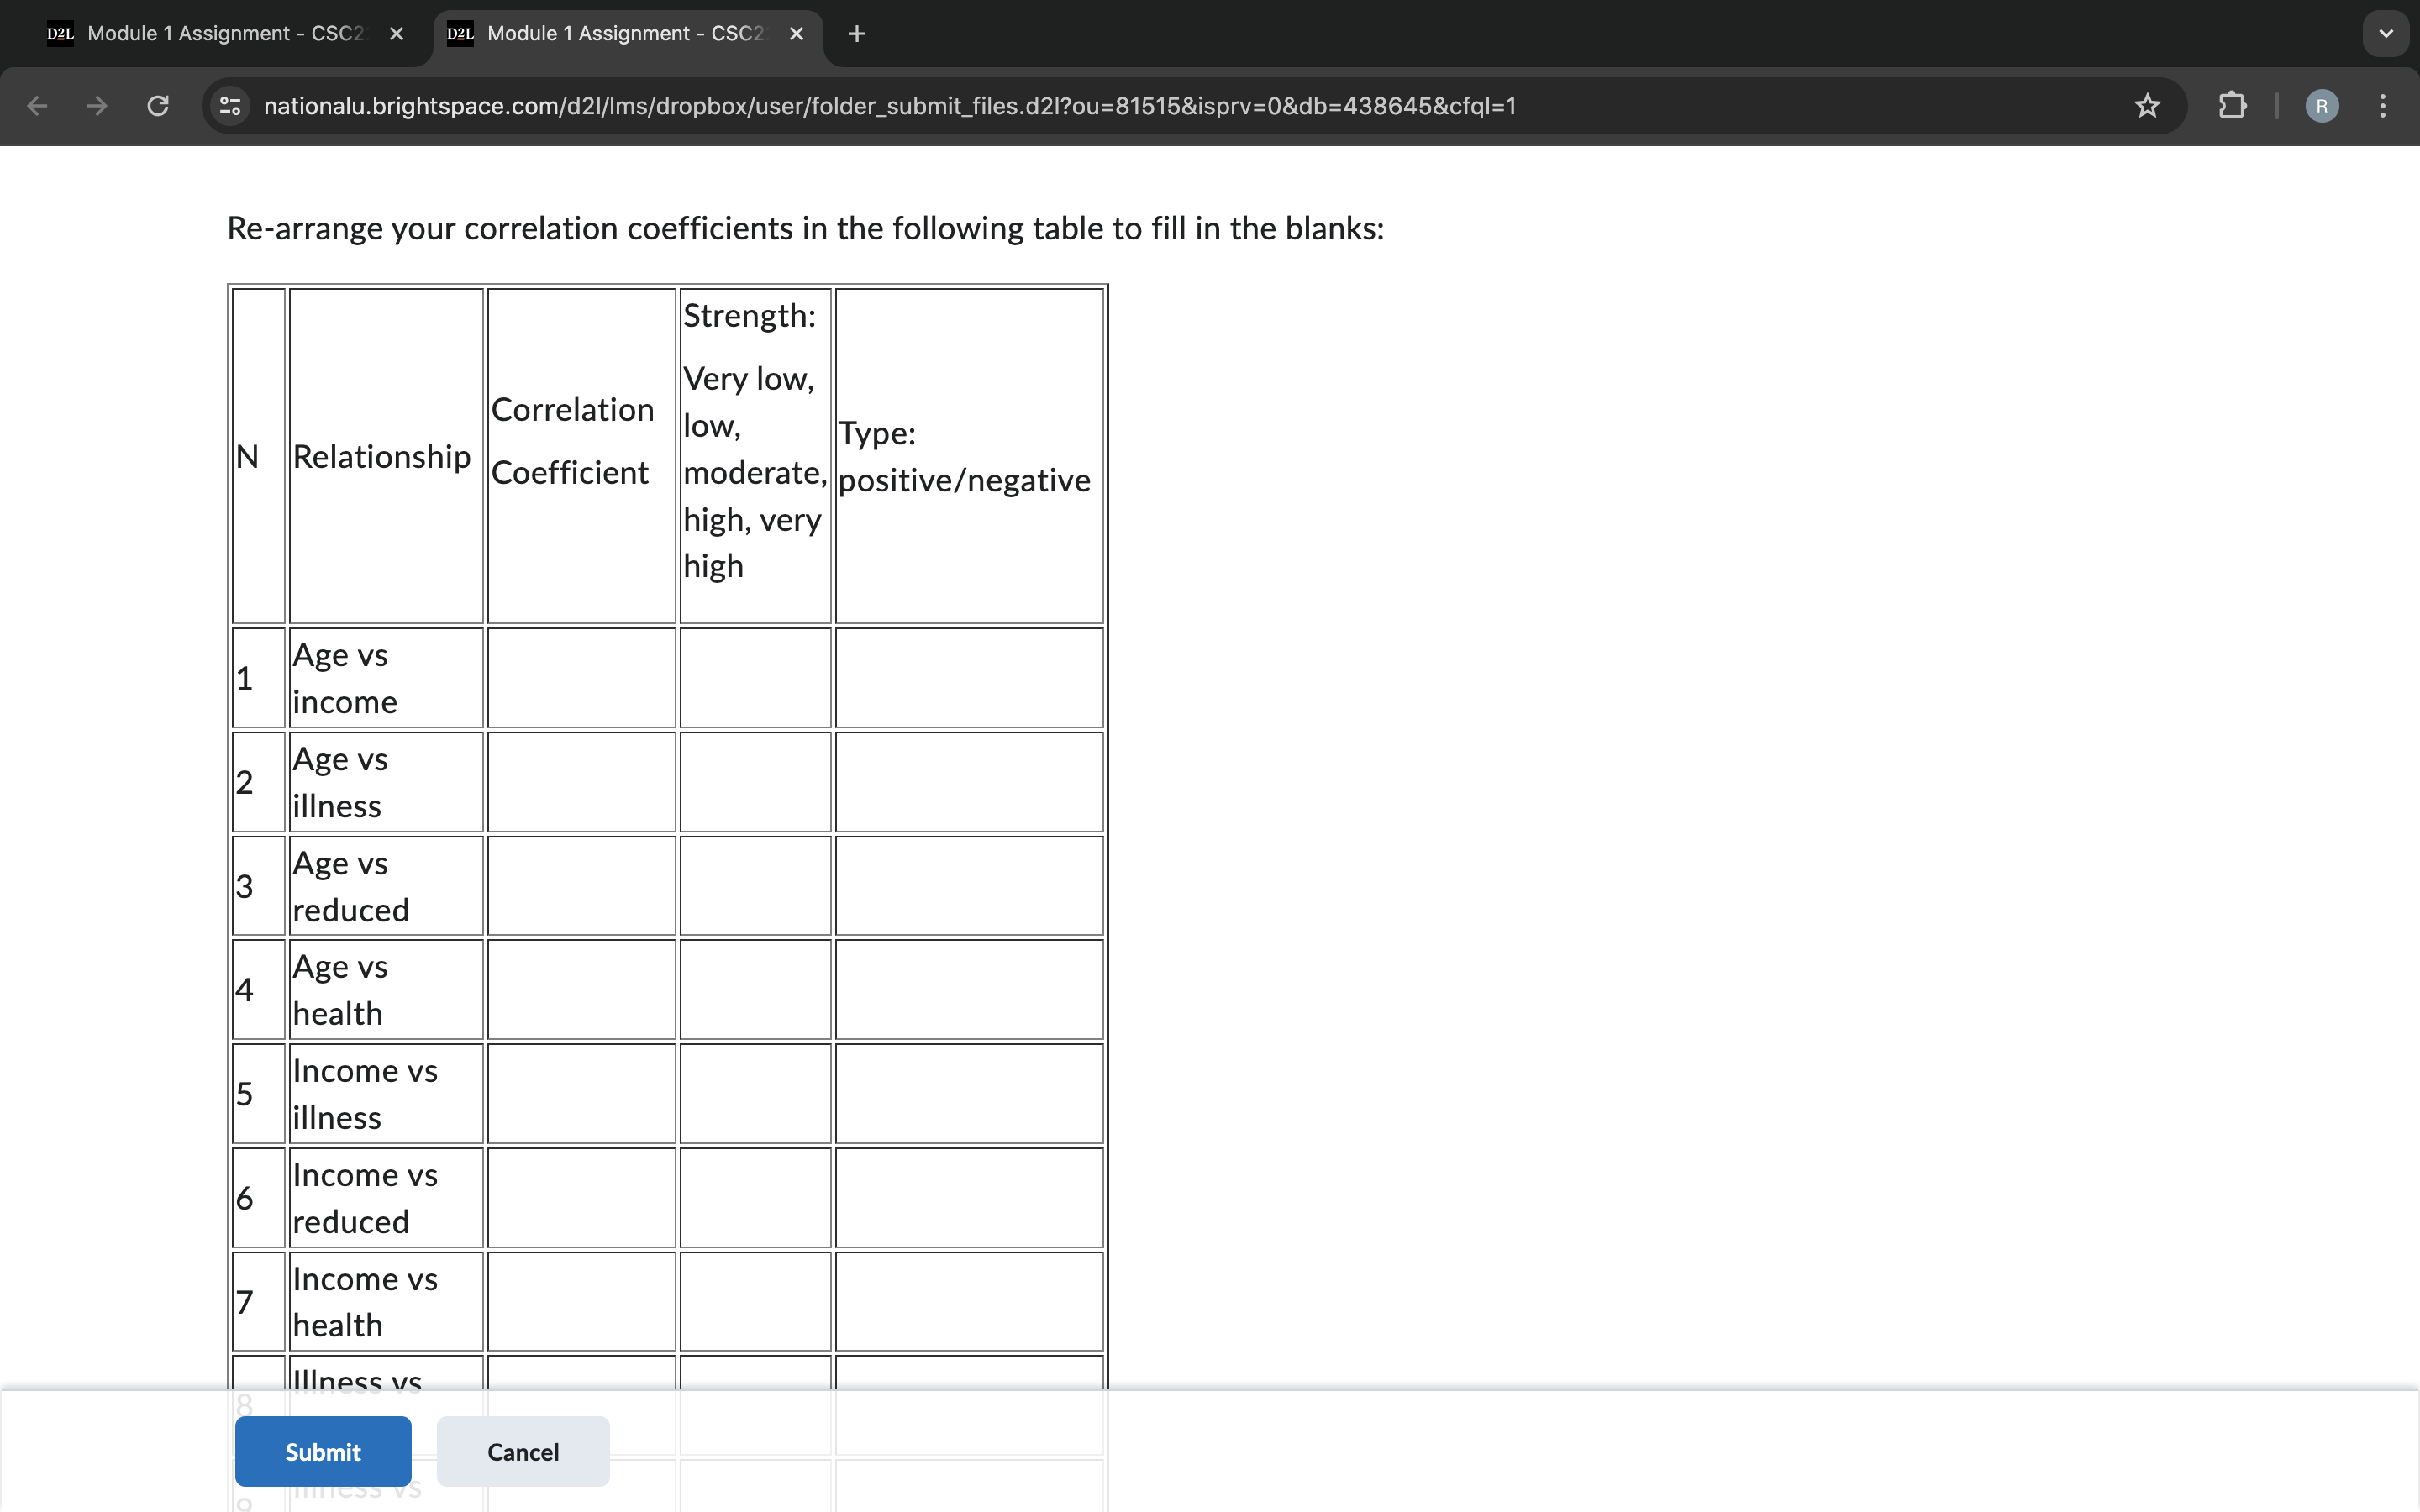
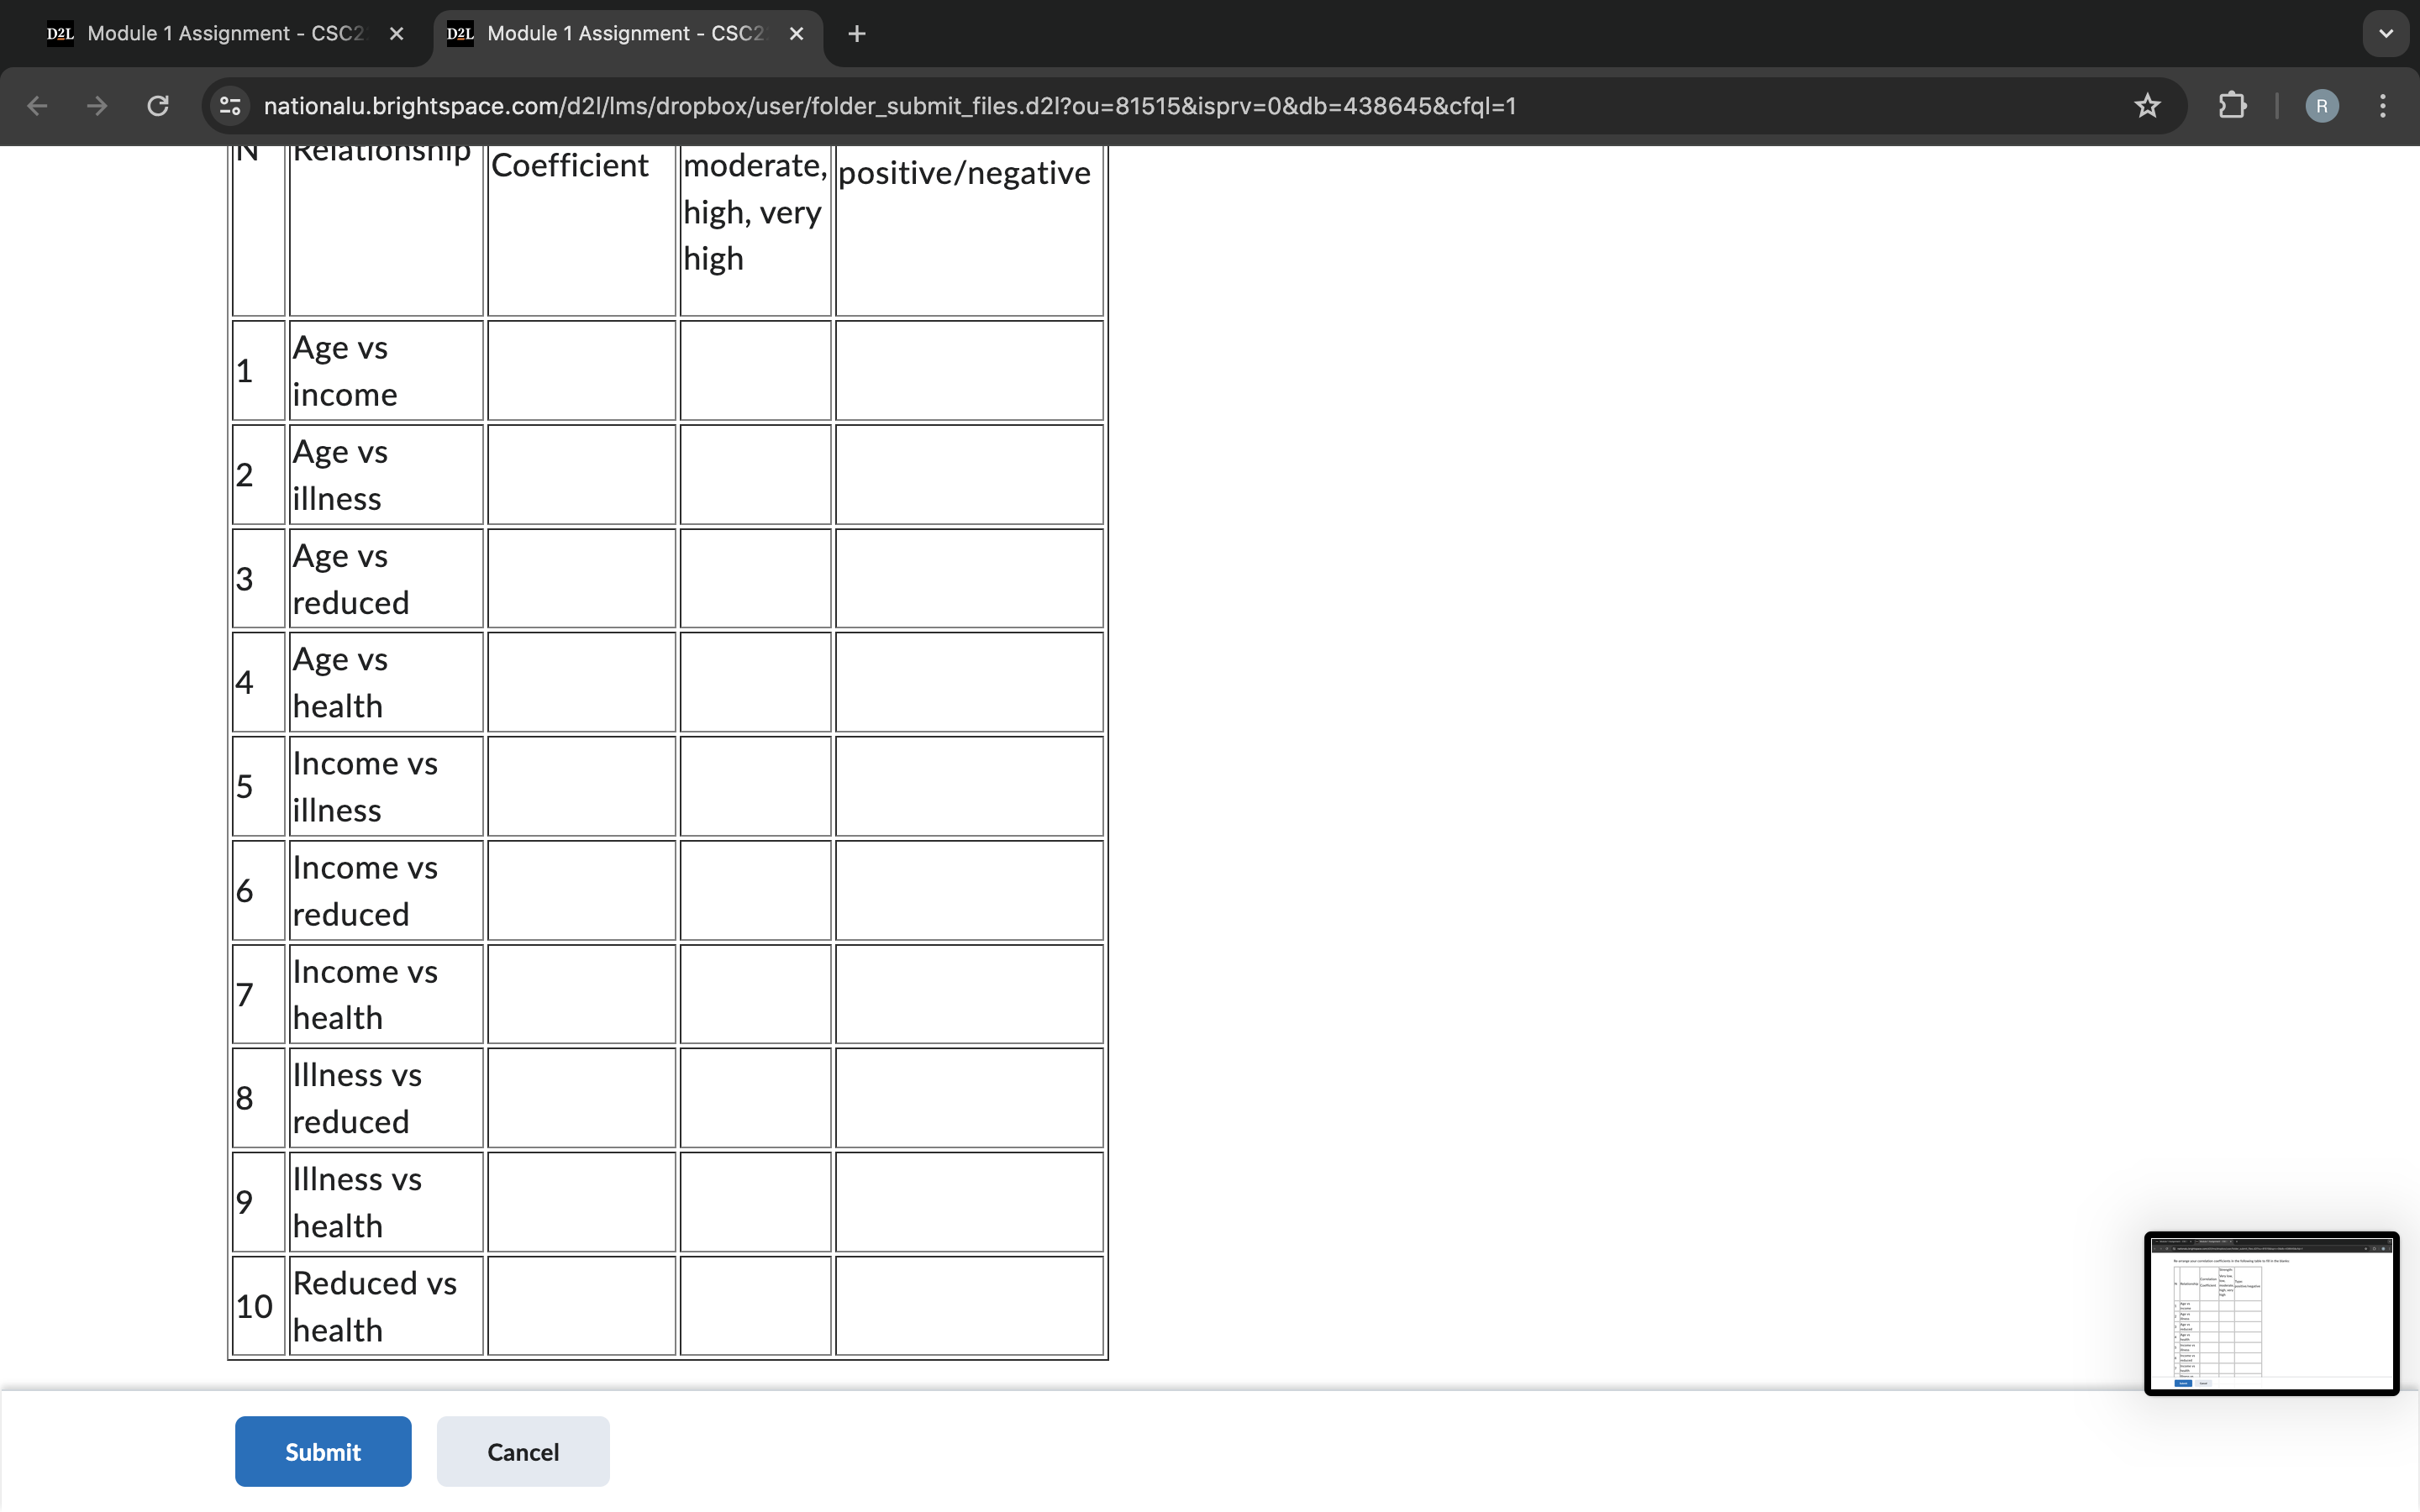
p2L Module 1 Assignment - CSC X D2l Module 1 Assignment - CSCZ X o (6 25 nationalu.brightspace.com/d2l/Ims/dropbox/user/folder_submit_files.d2I?ou=81515&isprv=0&db=438645&cfql=1 Instructions Use MS Excel or Google Sheets to complete the computational questions. 1. In Chapter 1, in the ADHD Treatment (AT) case study, what is the independent variable of this experiment? How many levels does it have? What is the dependent variable? On what scale (nominal, ordinal, interval, ratio) was it measured? (4 points) 2. In Chapter 1, for the Angry Moods (AM) case study, which variables are the independent variables? What are the dependent variables? Is Anger-Out a quantitative or qualitative variable? (4 points) 3. Name 2 ways to graph quantitative variables and 3 ways to graph qualitative variables. (5 points) 4. Based on the frequency polygon displayed below, the most common test grade was around what score? Explain. (2 points) Frequency Cancel p2L Module 1 Assignment - CSC X D2l Module 1 Assignment - CSCZ X o (6 25 nationalu.brightspace.com/d2l/Ims/dropbox/user/folder_submit_files.d2I?ou=81515&isprv=0&db=438645&cfql=1 5. In a box plot, what percent of the scores are between the lower and upper hinges? (2 points) 6. A student has decided to display the results of his project on the number of hours people in various countries slept per night. He compared the sleeping patterns of people from the US, Brazil, France, Turkey, China, Egypt, Canada, Norway, and Spain. He was planning on using a line graph to display this data. Is a line graph appropriate? What might be a better choice for a graph? (2 points) 7. (40 points) For the data in the textbook, from the 1977 Stat. and Biom. 200 class for eye color, using Excel construct: [ Eye Color | Number of students | Brown 11 Blue 10 Green 4 Gray a. pie graph b. horizontal bar graph c. vertical bar graph d. a frequency table with the relative frequency of each eye color m Cancel D2L Module 1 Assignment - CSC2 X D2L Module 1 Assignment - CSC2 X G go nationalu.brightspace.com/d21/Ims/dropbox/user/folder_submit_files.d21?ou=81515&isprv=0&db=438645&cfql=1 R . .. 8. (2 points) Which of the box plots on the graph has a large positive skew? Which has a large negative skew? o O C. A. B The following question are from the Angry Moods (AM) case study. 9. (10 points) (AM) Is there a difference in how much males and females use aggressive behavior to improve an angry mood? For the "Anger-Out" scores: a. Create parallel box plots. b. Create a back-to-back stem and leaf displays (You may have trouble finding a do this do it by ba fixed width fort Submit CancelD2L Module 1 Assignment - CSC2 X D2L Module 1 Assignment - CSC2 X C go nationalu.brightspace.com/d21/Ims/dropbox/user/folder_submit_files.d21?ou=81515&isprv=0&db=438645&cfql=1 R . .. 9. (10 points) (AM) Is there a difference in how much males and females use aggressive behavior to improve an angry mood? For the "Anger-Out" scores: a. Create parallel box plots. b. Create a back-to-back stem and leaf displays (You may have trouble finding a computer to do this so you may have to do it by hand. Use a fixed-width font such as Courier.) 10. (20 points) Conduct correlation analysis for the following variables from DoctorVisits.xIsx: age income illness reduced health age income illness reduced health Use the following scale to interpret the results. Scale of Correlation Coefficient Value 0
Step by Step Solution
There are 3 Steps involved in it
Step: 1
Get Instant Access to Expert-Tailored Solutions
See step-by-step solutions with expert insights and AI powered tools for academic success
Step: 2
Step: 3
Ace Your Homework with AI
Get the answers you need in no time with our AI-driven, step-by-step assistance