Answered step by step
Verified Expert Solution
Question
1 Approved Answer
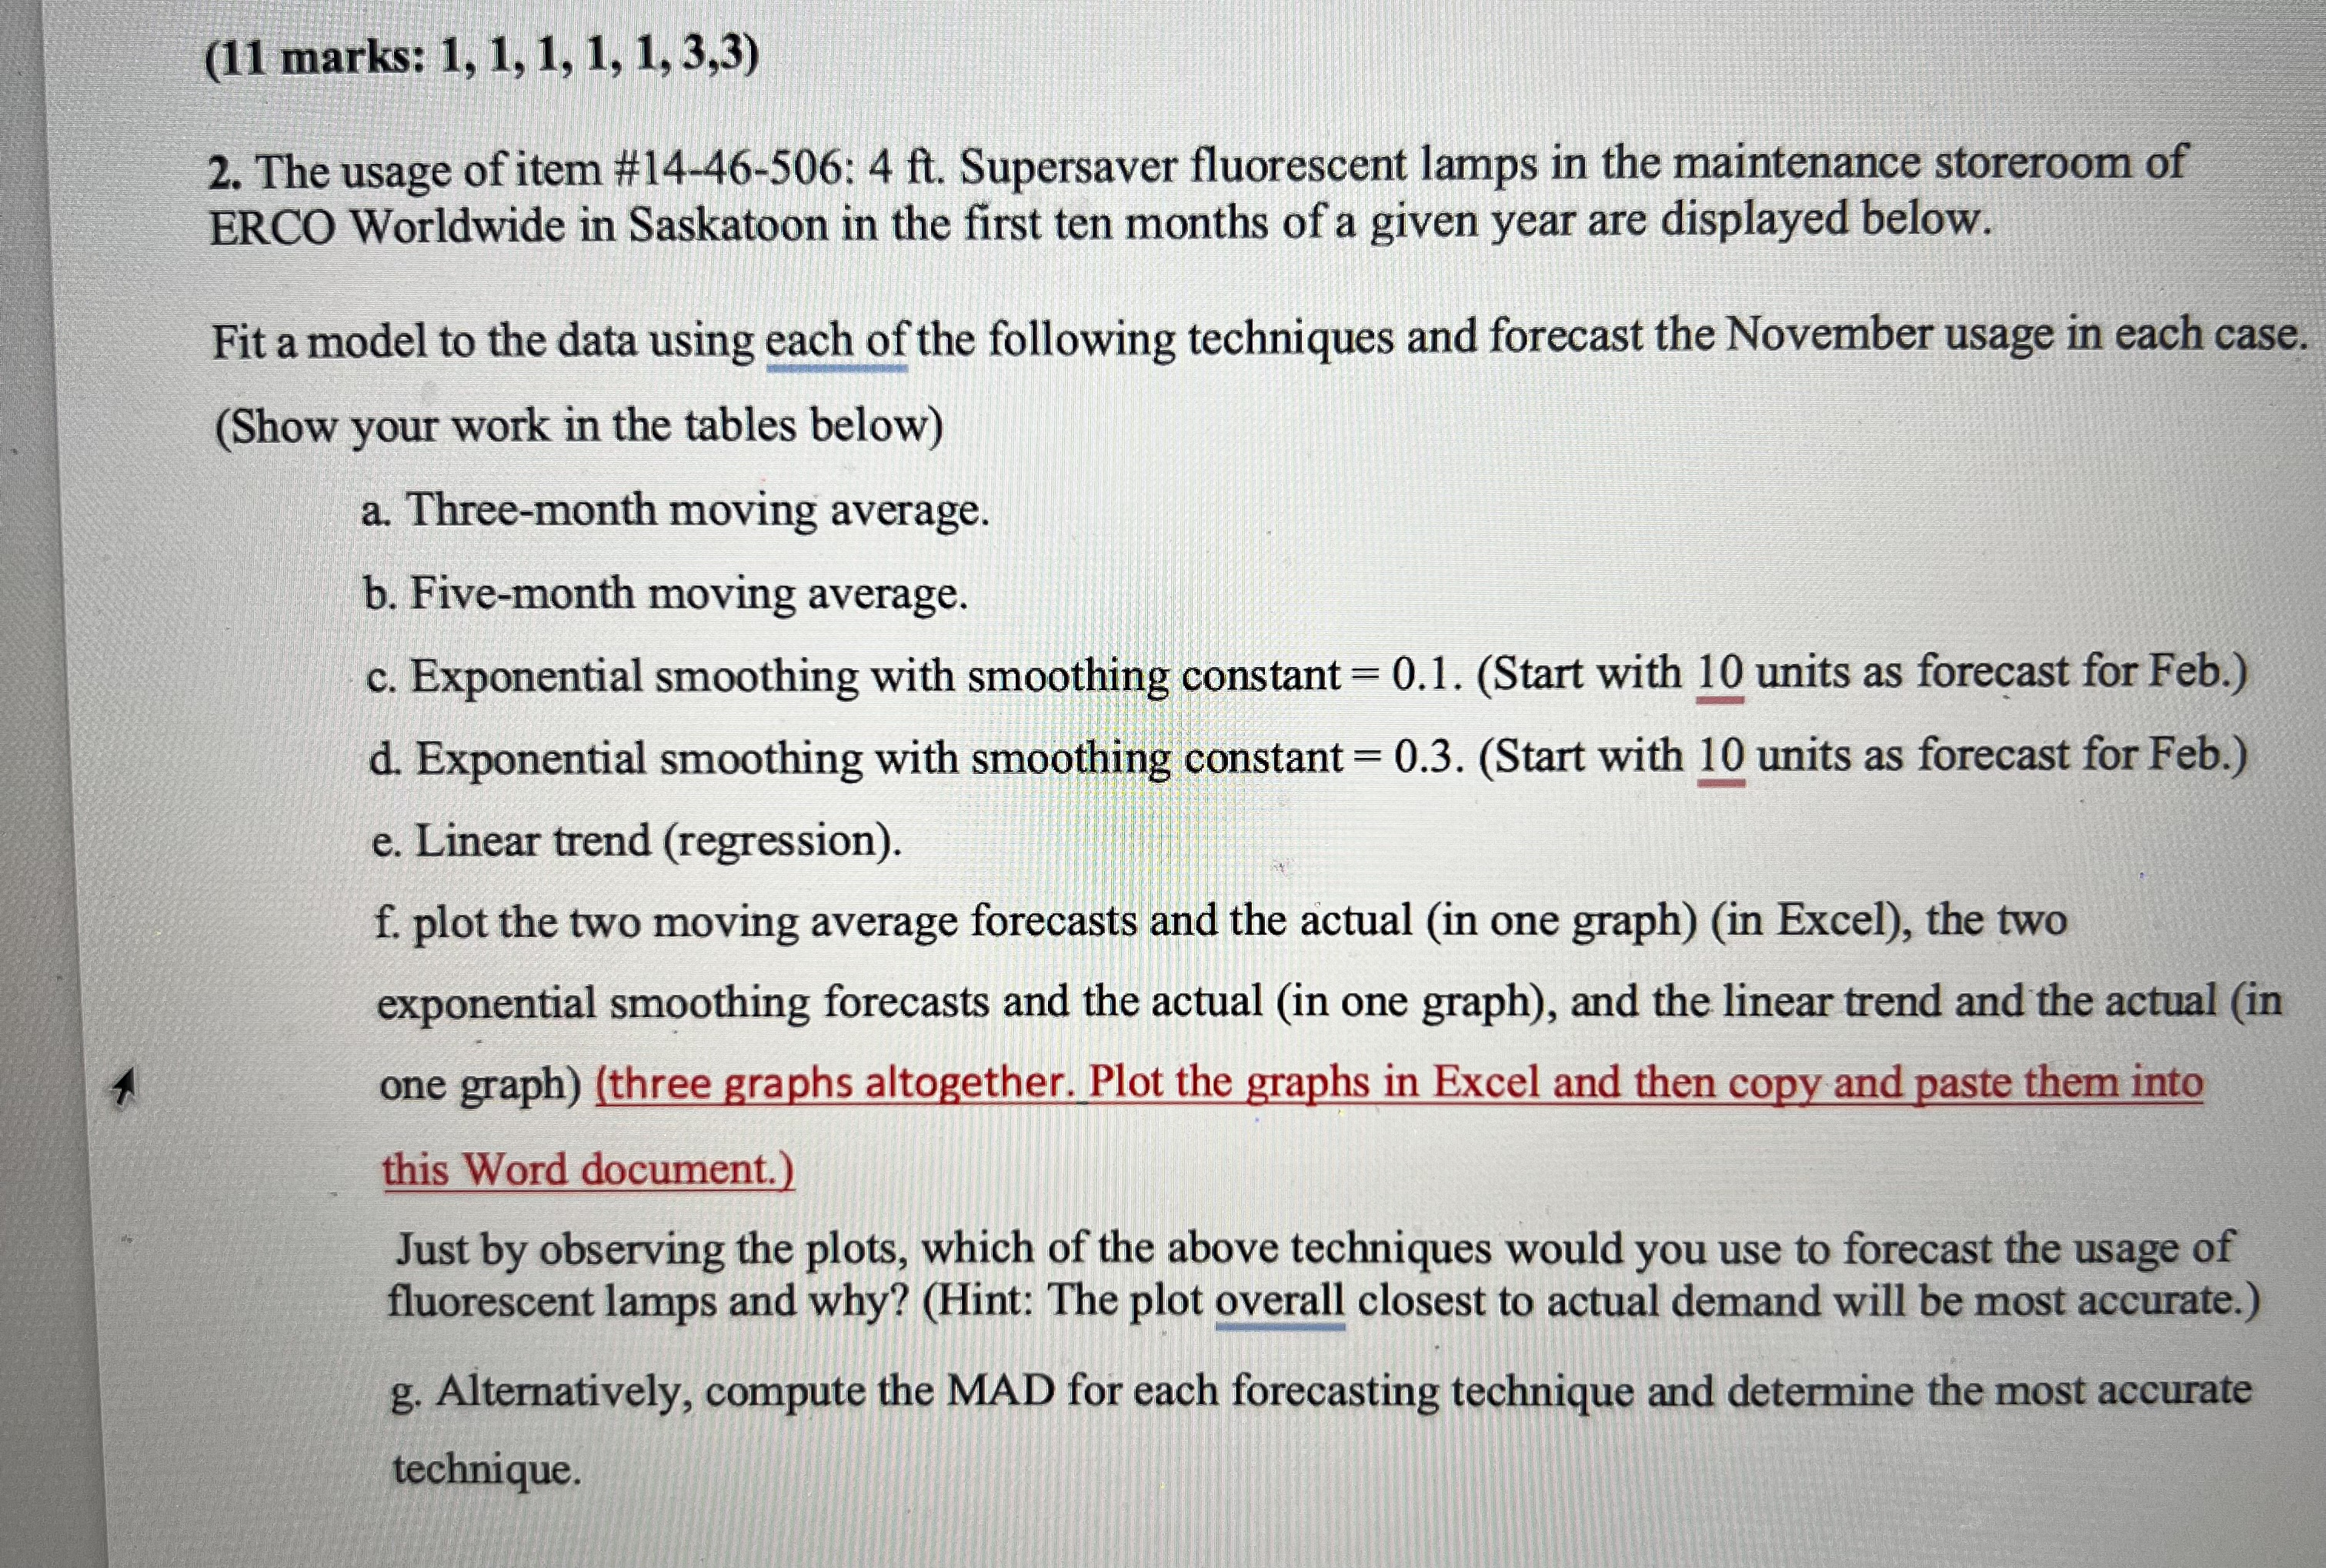
( 1 1 marks: 1 , 1 , 1 , 1 , 1 , 3 , 3 ) The usage of item # 1 4
marks:
The usage of item #: Supersaver fluorescent lamps in the maintenance storeroom of
ERCO Worldwide in Saskatoon in the first ten months of a given year are displayed below.
Fit a model to the data using each of the following techniques and forecast the November usage in each case.
Show your work in the tables below
a Threemonth moving average.
b Fivemonth moving average.
c Exponential smoothing with smoothing constant Start with units as forecast for Feb.
d Exponential smoothing with smoothing constant Start with units as forecast for Feb.
e Linear trend regression
f plot the two moving average forecasts and the actual in one graphin Excel the two
exponential smoothing forecasts and the actual in one graph and the linear trend and the actual in
one graphthree graphs altogether. Plot the graphs in Excel and then copy and paste them into
this Word document.
Just by observing the plots, which of the above techniques would you use to forecast the usage of
fluorescent lamps and why? Hint: The plot overall closest to actual demand will be most accurate.
g Alternatively, compute the MAD for each forecasting technique and determine the most accurate
technique.

Step by Step Solution
There are 3 Steps involved in it
Step: 1

Get Instant Access to Expert-Tailored Solutions
See step-by-step solutions with expert insights and AI powered tools for academic success
Step: 2

Step: 3

Ace Your Homework with AI
Get the answers you need in no time with our AI-driven, step-by-step assistance
Get Started


