1 1 point Which of the following tasks are best-suited to each of the data displays we've talked about? figuring out whether two events are
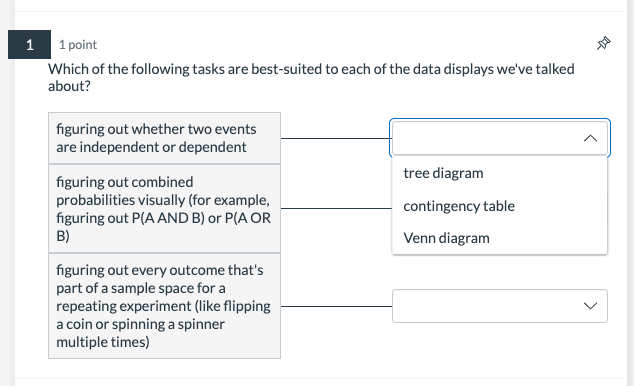
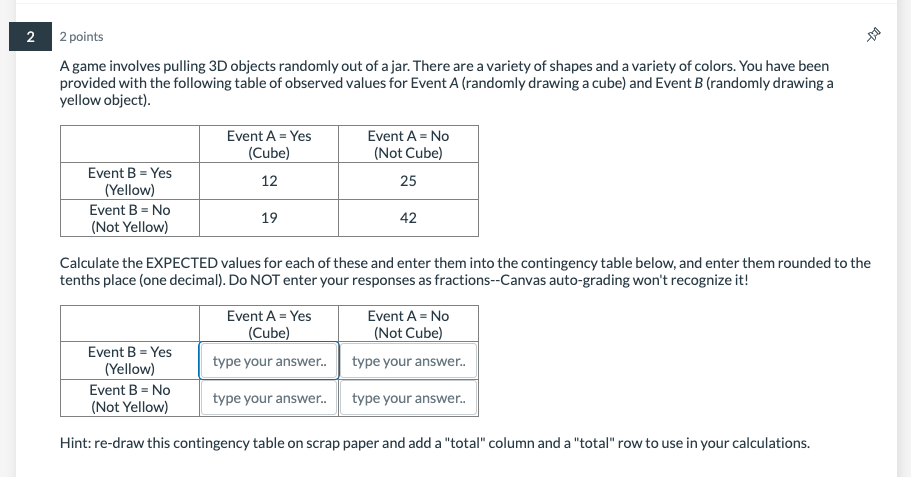
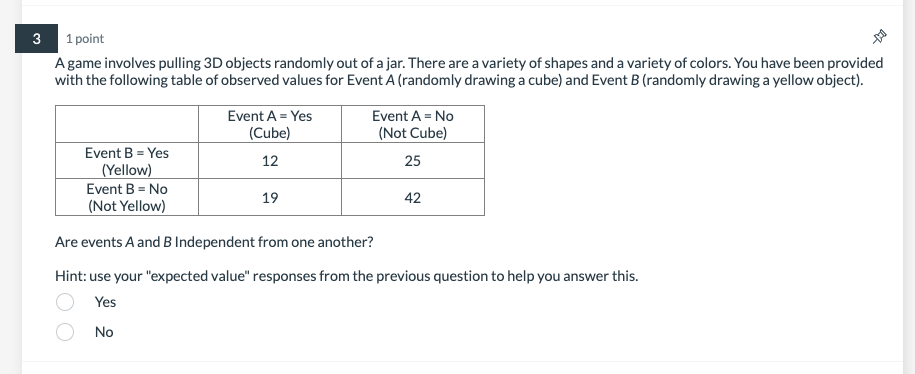
1 1 point Which of the following tasks are best-suited to each of the data displays we've talked about? figuring out whether two events are independent or dependent figuring out combined tree diagram probabilities visually (for example, figuring out P(A AND B) or P(A OR contingency table B) Venn diagram figuring out every outcome that's part of a sample space for a repeating experiment (like flipping a coin or spinning a spinner multiple times)2 2 points A game involves pulling 3D objects randomly out of a jar. There are a variety of shapes and a variety of colors. You have been provided with the following table of observed values for Event A (randomly drawing a cube) and Event B (randomly drawing a yellow object). Event A = Yes Event A = No (Cube) (Not Cube) Event B = Yes (Yellow) 12 25 Event B = No 19 42 (Not Yellow) Calculate the EXPECTED values for each of these and enter them into the contingency table below, and enter them rounded to the tenths place (one decimal). Do NOT enter your responses as fractions--Canvas auto-grading won't recognize it! Event A = Yes Event A = No (Cube) (Not Cube) Event B = Yes (Yellow) type your answer.. type your answer.. Event B = No (Not Yellow) type your answer.. type your answer.. Hint: re-draw this contingency table on scrap paper and add a "total" column and a "total" row to use in your calculations.1 point 9 A game involves pulling 30 objects randomly out oi a jar. There are a variety of shapes and a variety of colors. You have been provided with the following table of observed values for Event A {randomly drawing a cube} and Event B {randomly drawing a yellow object}. Event A = Yes Event A = No {Cube} {Not Cube] Event B = Yes {Yellow} 25 Event B = No [NotYe-llow] 19 42 Are events A and B Independent from one another? Hint: use your "expected value" responses from the previous question to help you answer this. Yes No 1 point You flipa fair coin 4 times. What is the probability that you will get exactly two heads and two tails? Provide your answer as a decimal to the nearest hundredth {two decimal places] Hint: use a tree diagram to help you answer this. Type your answer... 1 point You have a fair spinner with three even sections-red, yellow. and blue. It you spin the spinner three times, what is the probability of landing on yellow exactly two of those three times? Provide your answer as a decimal to the nearest hundredth {two decimal places] Hint: use a tree diagram to help you answer this. Type your answe r... 6 2 points This contingency table shows what the children at a block party asked for when told they could have one of three flavors of ice cream and one of three toppings. Use the table to fill in the missing observed frequencies. (hint: use the totals) Chocolate Vanilla Strawberry Total Rainbow Sprinkles 12 9 type your answe 35 Chocolate Sauce 16 14 9 39 Caramel Syrup 11 type you 8 26 Total type your ans' 30 31 type you1 point Thefollowing Venn diagram shows the sample space.event H. and event (3 for a chance experiment that involves spinning a spinner with equalsized blue (Bi, red {R}. and yellow ['1'] sections two times. Based on this diagram. which of the following is an accurate description of event H? Event H = double red or double blue Event H = at least one spin lands on yel low Event H = one spin lands on red and the other on blue Event H = both spins landingon the samecolor 8 1 point The following Venn diagram shows the sample space, event H, and event G for a chance experiment that involves spinning a spinner with equal-sized blue (B), red (R), and yellow (Y) sections two times. YR RR YB G YY H BB BY RY BR RB Based on this diagram, what is P(H)? In other words, what is the probability of event H happening? Round your answer to the nearest hundredth (two decimal places) Type your answer.9 1 point The following Venn diagram shows the sample space, event H, and event G for a chance experiment that involves spinning a spinner with equal-sized blue (B), red (R), and yellow (Y) sections two times. YR RR YB G YY H BB BY RY BR RB Based on this diagram, what is P(G AND H)? Round your answer to the nearest hundredth (two decimal places) Type your answer..10 1 point The following Venn diagram shows the sample space, event H, and event G for a chance experiment that involves spinning a spinner with equal-sized blue (B), red (R), and yellow (Y) sections two times. YR RR YB G YY H BB BY RY BR RB Based on this diagram, what is P(G OR H)? Round your answer to the nearest hundredth (two decimal places) Type your
Step by Step Solution
There are 3 Steps involved in it
Step: 1
Get Instant Access to Expert-Tailored Solutions
See step-by-step solutions with expert insights and AI powered tools for academic success
Step: 2
Step: 3
Ace Your Homework with AI
Get the answers you need in no time with our AI-driven, step-by-step assistance