Answered step by step
Verified Expert Solution
Question
1 Approved Answer
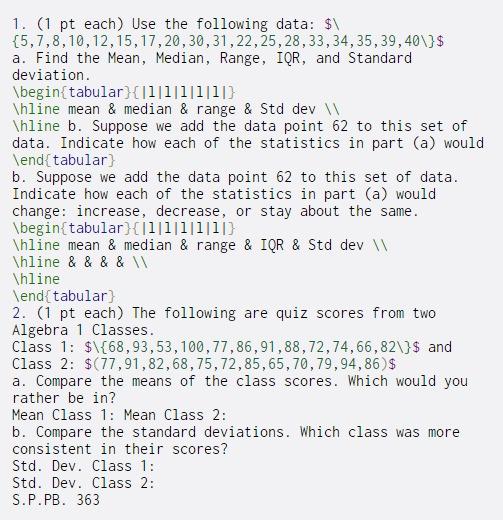
1. (1 pt each) Use the following data: $ {5,7,8,10,12,15,17,20,30,31,22,25,28,33,34,35,39,40}$ a. Find the Mean, Median, Range, IQR, and Standard deviation. begin{tabular}{[1111111] hline mean & median
1. (1 pt each) Use the following data: $\ {5,7,8,10,12,15,17,20,30,31,22,25,28,33,34,35,39,40\}$ a. Find the Mean, Median, Range, IQR, and Standard deviation. \begin{tabular}{[1111111] \hline mean & median & range & Std dev \hline b. Suppose we add the data point 62 to this set of data. Indicate how each of the statistics in part (a) would \end{tabular) b. Suppose we add the data point 62 to this set of data. Indicate how each of the statistics in part (a) would change: increase, decrease, or stay about the same. \begin{tabular [1]111]1[1]) \hline mean & median & range & IQR & Std dev \hline & & & & \hline \end{tabular 2. (1 pt each) The following are quiz scores from two Algebra 1 Classes. Class 1: $\{68,93,53, 100,77,86,91,88,72,74,66,82\}$ and Class 2: $(77,91,82,68,75,72,85,65,70,79,94,86)$ a. Compare the means of the class scores. Which would you rather be in? Mean Class 1: Mean Class 2: b. Compare the standard deviations. Which class was more consistent in their scores? Std. Dev. Class 1: Std. Dev. Class 2: S.P.PB. 363
Step by Step Solution
There are 3 Steps involved in it
Step: 1
Get Instant Access to Expert-Tailored Solutions
See step-by-step solutions with expert insights and AI powered tools for academic success
Step: 2
Step: 3
Ace Your Homework with AI
Get the answers you need in no time with our AI-driven, step-by-step assistance
Get Started