

Answered step by step
Verified Expert Solution
Question
1 Approved Answer
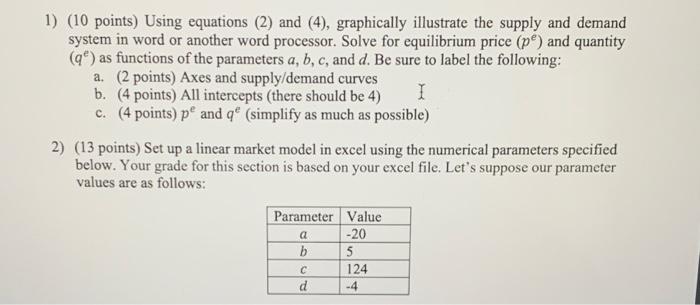
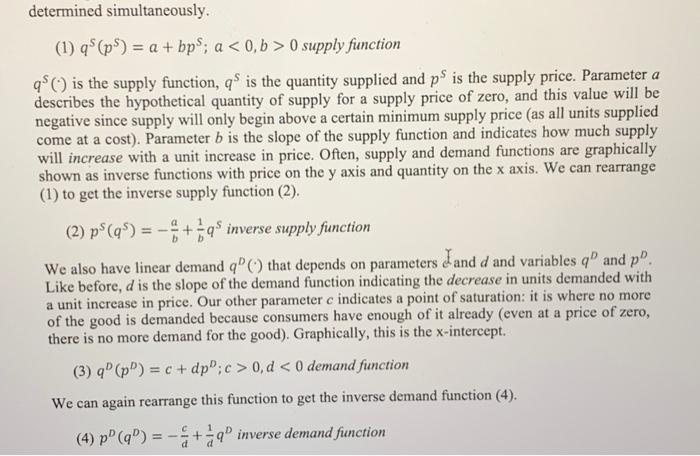
1) (10 points) Using equations (2) and (4), graphically illustrate the supply and demand system in word or another word processor. Solve for equilibrium price
Step by Step Solution
There are 3 Steps involved in it
Step: 1

Get Instant Access to Expert-Tailored Solutions
See step-by-step solutions with expert insights and AI powered tools for academic success
Step: 2

Step: 3
Ace Your Homework with AI
Get the answers you need in no time with our AI-driven, step-by-step assistance
Get Started
Financial Markets And Institutions
Authors: Peter Howells, Keith Bain
5th Edition
0273709194, 9780273709190