

Answered step by step
Verified Expert Solution
Question
1 Approved Answer
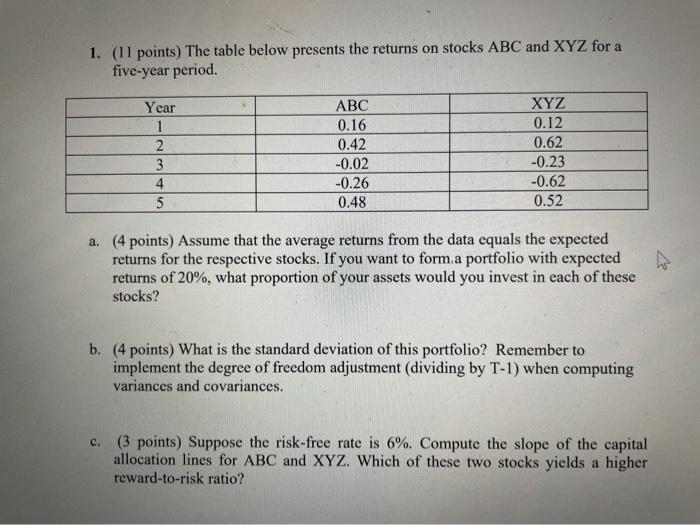
1. (11 points) The table below presents the returns on stocks ABC and XYZ for a five-year period. Year 1 2 3 4 5 ABC
Step by Step Solution
There are 3 Steps involved in it
Step: 1

Get Instant Access to Expert-Tailored Solutions
See step-by-step solutions with expert insights and AI powered tools for academic success
Step: 2

Step: 3
Ace Your Homework with AI
Get the answers you need in no time with our AI-driven, step-by-step assistance
Get Started
Valuing Early Stage And Venture Backed Companies
Authors: Neil J. Beaton
1st Edition
0470436298, 978-0470436295