Answered step by step
Verified Expert Solution
Link Copied!

Question

1 Approved Answer

1. [13 points in total] Draw a basic aggregate demand and supply graph (with LRAS constant) that shows the economy is in long-run equilibrium, label
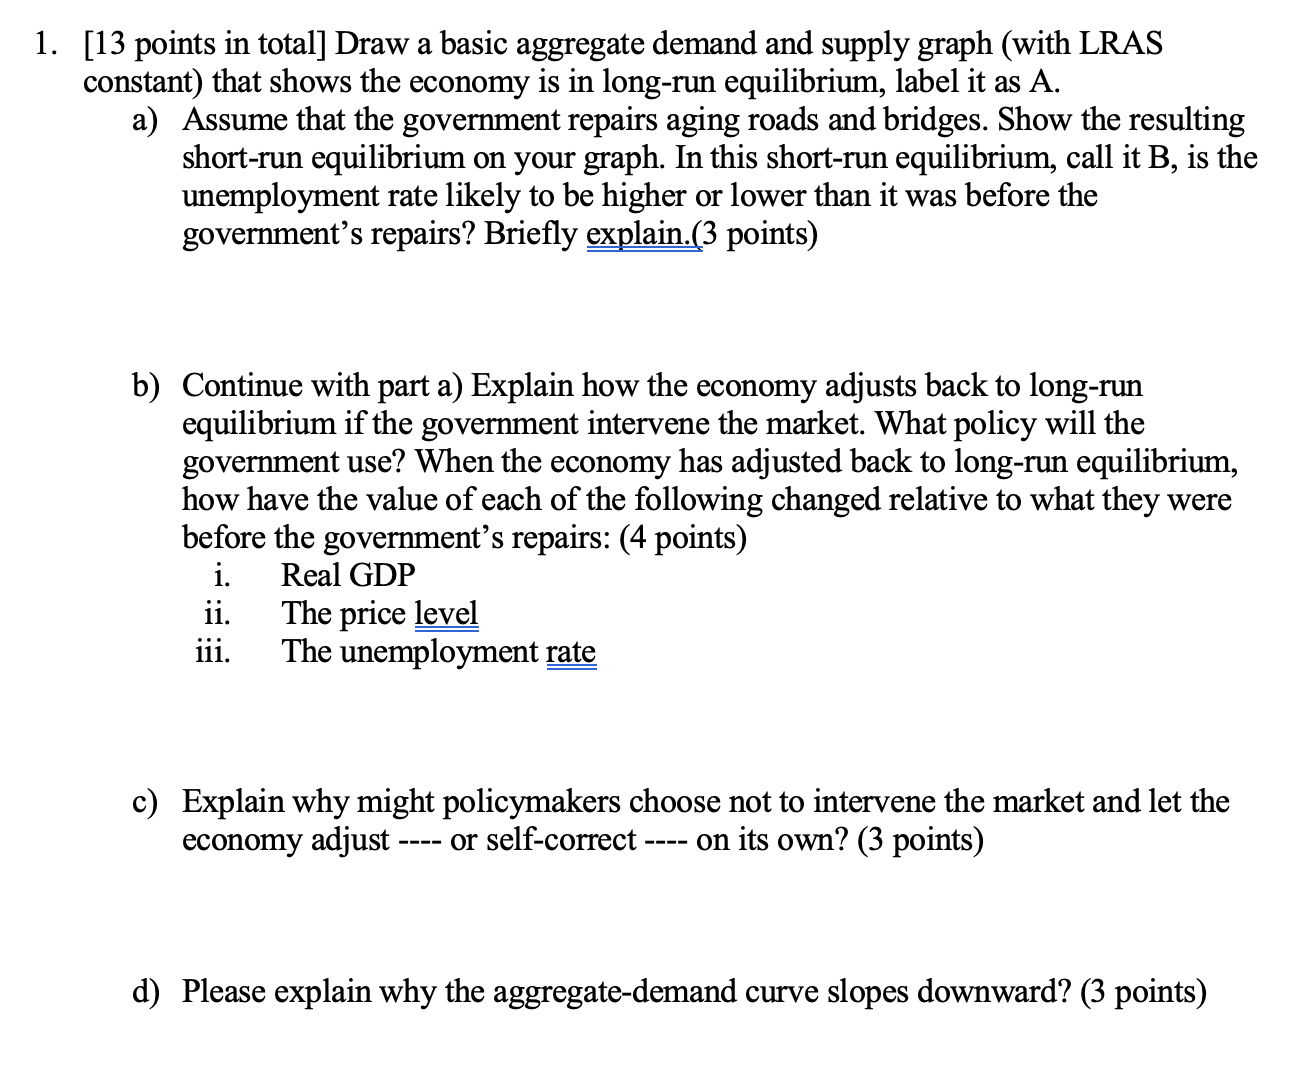
image text in transcribed
1. [13 points in total] Draw a basic aggregate demand and supply graph (with LRAS constant) that shows the economy is in long-run equilibrium, label it as A. a) b) Assume that the government repairs aging roads and bridges. Show the resulting short-run equilibrium on your graph. In this short-run equilibrium, call it B, is the unemployment rate likely to be higher or lower than it was before the govemment's repairs? Briey explain.g3 points) Continue with part a) Explain how the economy adjusts back to long-run equilibrium if the government intervene the market. What policy will the government use? When the economy has adjusted back to long-run equilibrium, how have the value of each of the following changed relative to what they were before the govemment's repairs: (4 points) i. Real GDP ii. The price iii. The unemployment ra=te Explain why might policymakers choose not to intervene the market and let the economy adjust ---- or self-correct ---- on its own? (3 points) d) Please explain why the aggregate-demand curve slopes downward? (3 points)

Step by Step Solution

There are 3 Steps involved in it

Step: 1

blur-text-image

Get Instant Access to Expert-Tailored Solutions

See step-by-step solutions with expert insights and AI powered tools for academic success

Step: 2

blur-text-image

Step: 3

blur-text-image

Ace Your Homework with AI

Get the answers you need in no time with our AI-driven, step-by-step assistance

Get Started

Recommended Textbook for

Using R For Econometrics

Authors: Florian Heiss

1st Edition

1523285133, 9781523285136

More Books

Students also viewed these Economics questions

Question

Describe three other types of visual aids.

Answered: 1 week ago