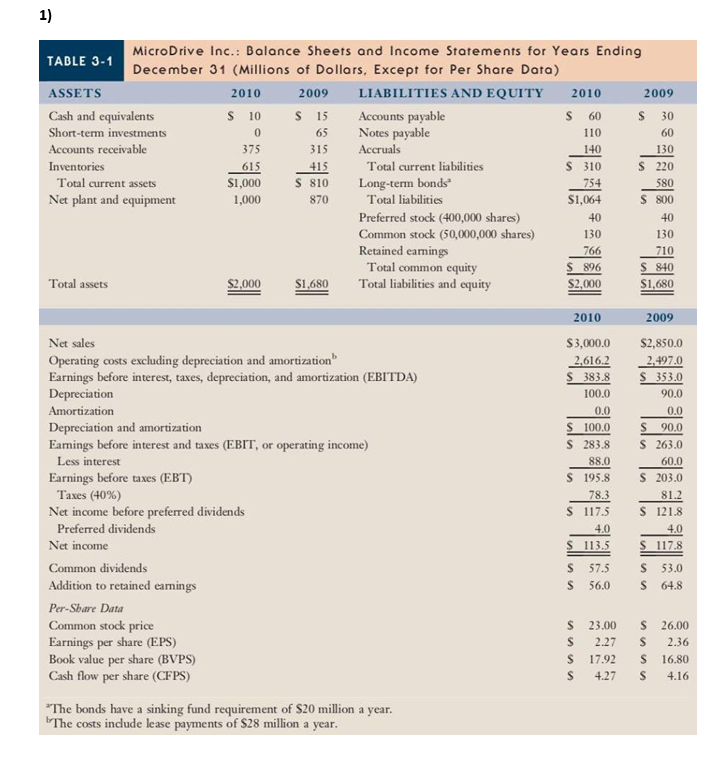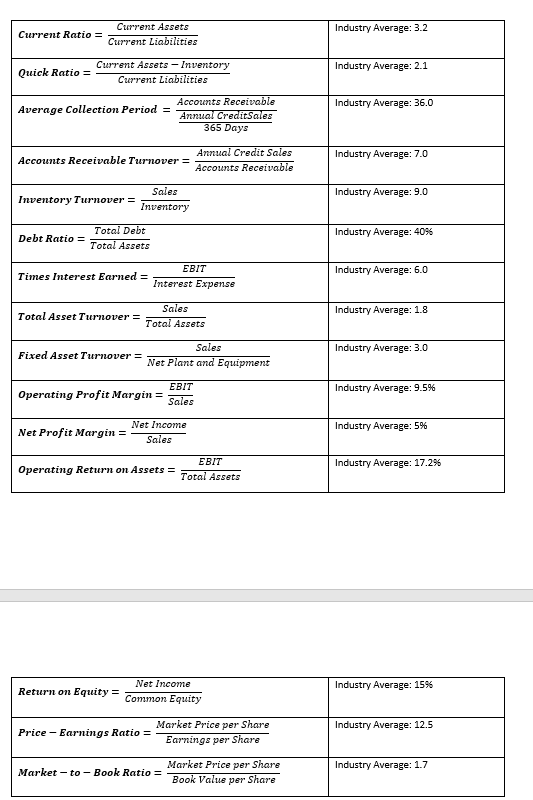


1) 130 TABLE 3-1 Micro Drive Inc.: Balance Sheets and Income Statements for Years Ending December 31 (Millions of Dollars, Except for Per Share Data) ASSETS 2010 2009 LIABILITIES AND EQUITY 2010 2009 Cash and equivalents $ 10 S 15 Accounts payable $ 60 $ 30 Short-term investments 0 65 Notes payable 110 60 Accounts receivable 375 315 Accruals 140 Inventories 615 415 Total current liabilities $ 310 $ 220 Total current assets $1,000 S 810 Long-term bonds 754 580 Net plant and equipment 1,000 870 Total liabilities $1,064 S 800 Preferred stock (400,000 shares) 40 Common stock (50,000,000 shares) 130 130 Retained earnings 766 710 Total common equity $ 896 S 840 Total assets $2,000 $1,680 Total liabilities and equity $2,000 $1,680 40 2010 2009 Net sales Operating costs excluding depreciation and amortization Earnings before interest, taxes, depreciation, and amortization (EBITDA) Depreciation Amortization Depreciation and amortization Earnings before interest and taxes (EBIT, or operating income) Less interest Earnings before taxes (EBT) Taxes (40%) Net income before preferred dividends Preferred dividends Net income Common dividends Addition to retained earnings Per-Share Data Common stock price Ear ngs per share (EPS) Book value per share (BVPS) Cash flow per share (CFPS) $3,000.0 2,616.2 S 383.8 100.0 0.0 $ 100.0 S 283.8 88.0 S 195.8 78.3 S 117.5 4.0 S 113.5 $2,850.0 2,497.0 S 353.0 90.0 0.0 S 90.0 $ 263.0 60.0 S 203.0 81.2 S 121.8 4.0 S 117.8 53.0 S S 57.5 56.0 S S 64.8 26.00 2.36 S 23.00 S 2.27 $17.92 $ 4.27 S S S $ 16.80 4.16 *The bonds have a sinking fund requirement of $20 million a year. The costs include lease payments of $28 million a year. The Income Statement and Balance Sheet belonging to MicroDrive Inc. is given to you to answer the following questions about the company's financial health in 2009 and 2010. As an investor, you are required to analyze these statements using the appropriate ratios, make a comment on the firms financial performance and how it has changed between the two years. (Please use the appropriate financial ratios to answer the questions.) (60 Points) a. Has the firm earned adequate returns on its investments? (10 Points) b. Are the firm's managers creating value for shareholders? (10 Points) Will you invest in this company? Why? (10 Points) c. Industry Average: 3.2 Current Ratio = Current Assets Current Liabilities Current Assets - Inventory Current Liabilities Industry Average: 2.1 Quick Ratio = Industry Average: 36.0 Average Collection Period = Accounts Receivable Annual Credit Sales 365 Days Annual Credit Sales Accounts Receivable Industry Average: 7.0 Accounts Receivable Turnover = Industry Average: 9.0 Inventory Turnover = Sales Inventory Total Debt Total Assets Industry Average: 40% Debt Ratio = EBIT Times Interest Earned = Interest Expense Industry Average: 6.0 Industry Average: 1.8 Total Asset Turnover = Sales Total Assets Industry Average: 3.0 Sales Fixed Asset Turnover = Net Plant and Equipment EBIT Operating Profit Margin= Sales Industry Average: 9.5% Net Income Net Profit Margin = Sales Industry Average: 5% EBIT Total Assets Industry Average: 17.2% Operating Return on Assets = Net Income Return on Equity = Common Equity Industry Average: 1596 Industry Average: 12.5 Market Price per Share Price - Earnings Ratio = Earnings per Share Industry Average: 1.7 Market Price per Share Market-to-Book Ratio = Book Value per Share


