Answered step by step
Verified Expert Solution
Question
1 Approved Answer
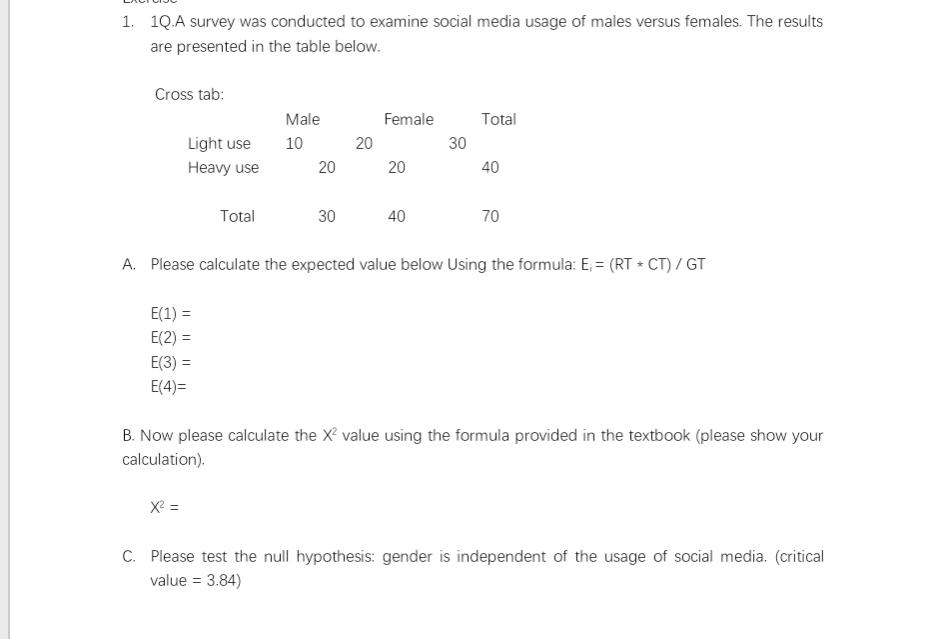
1. 1Q.A survey was conducted to examine social media usage of males versus females. The results are presented in the table below. Cross tab:

1. 1Q.A survey was conducted to examine social media usage of males versus females. The results are presented in the table below. Cross tab: Male Female Total Light use 10 20 30 Heavy use 20 20 40 Total 30 40 70 A. Please calculate the expected value below Using the formula: E = (RTCT) / GT E(1) = E(2) = E(3) = E(4)= B. Now please calculate the X value using the formula provided in the textbook (please show your calculation). X = C. Please test the null hypothesis: gender is independent of the usage of social media. (critical value = 3.84)
Step by Step Solution
There are 3 Steps involved in it
Step: 1
A Calculating the expected values using the formula Ei RT CT GT Where E1 30 30 70 E2 30 40 70 E3 4...
Get Instant Access to Expert-Tailored Solutions
See step-by-step solutions with expert insights and AI powered tools for academic success
Step: 2

Step: 3

Ace Your Homework with AI
Get the answers you need in no time with our AI-driven, step-by-step assistance
Get Started


