Answered step by step
Verified Expert Solution
Question
1 Approved Answer
1 2 3 4 5 6 7 8 9 10 11 12 13 14 15 16 17 18 19 20 21 22 23 24


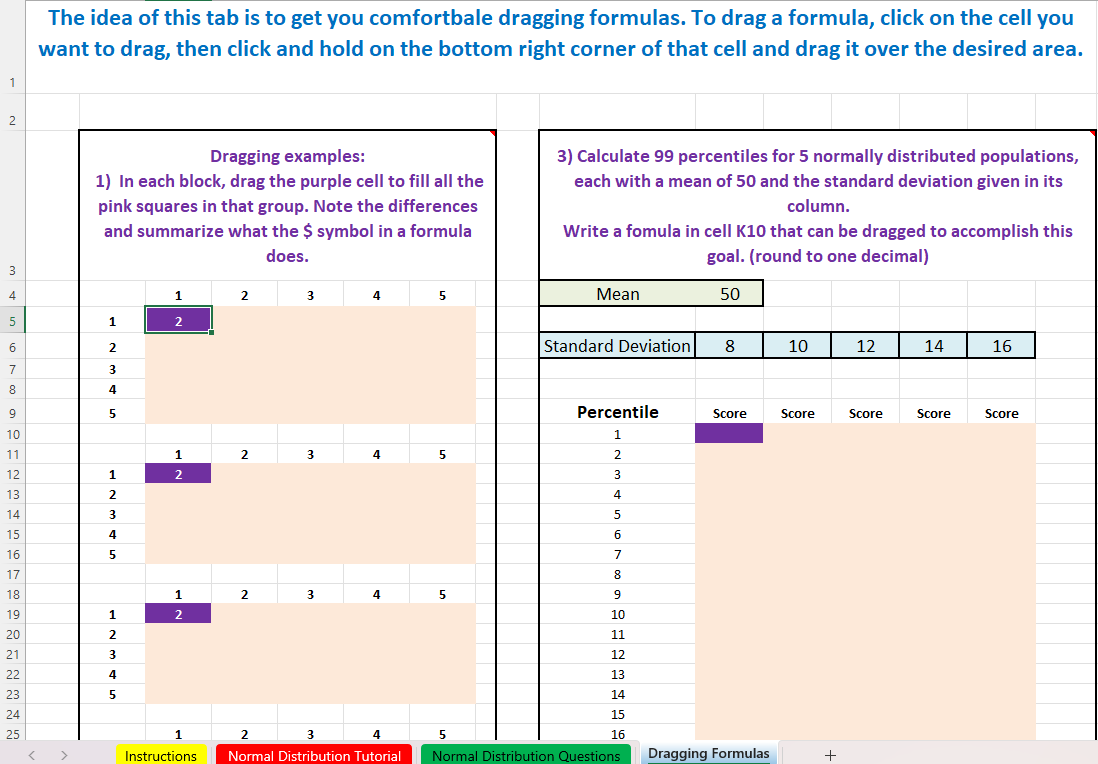
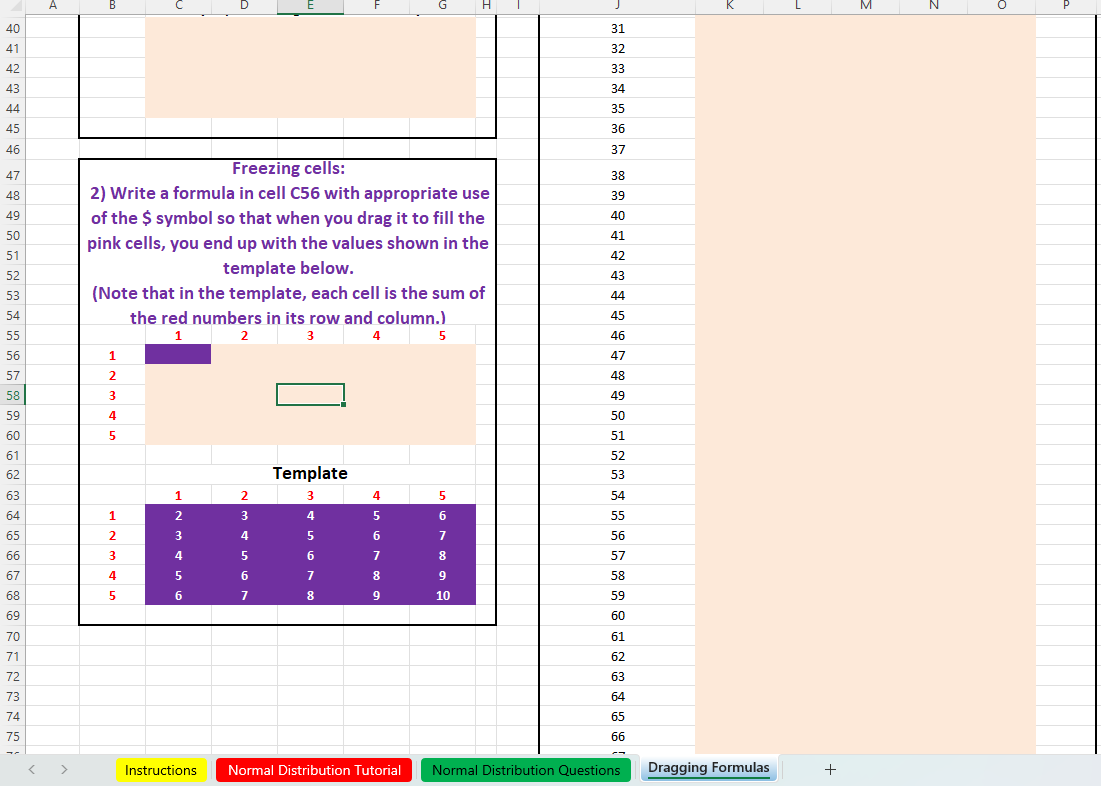
1 2 3 4 5 6 7 8 9 10 11 12 13 14 15 16 17 18 19 20 21 22 23 24 25 The idea of this tab is to get you comfortbale dragging formulas. To drag a formula, click on the cell you want to drag, then click and hold on the bottom right corner of that cell and drag it over the desired area. > Dragging examples: 1) In each block, drag the purple cell to fill all the pink squares in that group. Note the differences and summarize what the $ symbol in a formula does. 1 2 3 4 5 1 2 3 4 5 1 2 3 4 5 1 2 1 2 1 2 2 2 2 3 3 3 4 4 4 5 5 5 3) Calculate 99 percentiles for 5 normally distributed populations, each with a mean of 50 and the standard deviation given in its column. Write a fomula in cell K10 that can be dragged to accomplish this goal. (round to one decimal) 50 Mean Standard Deviation Percentile 1 2 3 4 5 6 7 8 9 10 11 12 13 14 15 16 2 5 Instructions Normal Distribution Tutorial Normal Distribution Questions 8 Score Dragging Formulas 10 Score + 12 Score 14 Score 16 Score 40 41 42 43 44 45 46 47 48 49 50 51 52 53 54 55 56 57 58 59 60 61 62 63 64 68688RFNANK 65 67 69 70 71 72 73 74 75 T A > B Freezing cells: 2) Write a formula in cell C56 with appropriate use of the $ symbol so that when you drag it to fill the pink cells, you end up with the values shown in the template below. (Note that in the template, each cell is the sum of the red numbers in its row and column.) 1 2 3 4 1 2 3 4 5 1 2 3 4 5 1 2 3 4 5 6 2 3 4 5 6 7 Template 3 4 5 6 7 8 4 5 6 7 8 9 5 H 5 6 7 8 9 10 31 32 33 34 35 36 37 38 39 40 41 42 43 44 45 46 47 48 49 50 51 52 53 54 55 56 57 58 59 60 61 62 63 64 65 66 Instructions Normal Distribution Tutorial Normal Distribution Questions Dragging Formulas +
Step by Step Solution
There are 3 Steps involved in it
Step: 1

Get Instant Access to Expert-Tailored Solutions
See step-by-step solutions with expert insights and AI powered tools for academic success
Step: 2

Step: 3

Ace Your Homework with AI
Get the answers you need in no time with our AI-driven, step-by-step assistance
Get Started


