Question
***** 1 2 3 4 5 6 7 8 9 10 **** Observations ***** 2 3 4 5 19.52 20.15 20.45 19.76 20.32 20.26 20.45
***** 1 2 3 4 5 6 7 8 9 10 **** Observations ***** 2 3 4 5 19.52 20.15 20.45 19.76 20.32 20.26 20.45 19.99 20.56 19.68 20.52 19.85 19.43 19.61 19.5 20.07 20.04 20.31 20.37 19.52 20.15 19.4 20.03 20.34 20.5 19.98 19.87 19.21 20.14 20.5 20.24 20.32 19.81 19.58 19.59 20.21 20.08 19.89 20.38 20.2 19.85 19.86 20.7 20.84 20.46 20.07 19.8 19.89 19.98 20.65 Sample 1 ** 6 20.49 20.29 19.76 19.86 20.17

20.32 20.68 20.04 20.01 20.16 Set up the X and R charts for the Buff n' Tuff filling process and show how you calculated the upper and lower control limits for each chart.
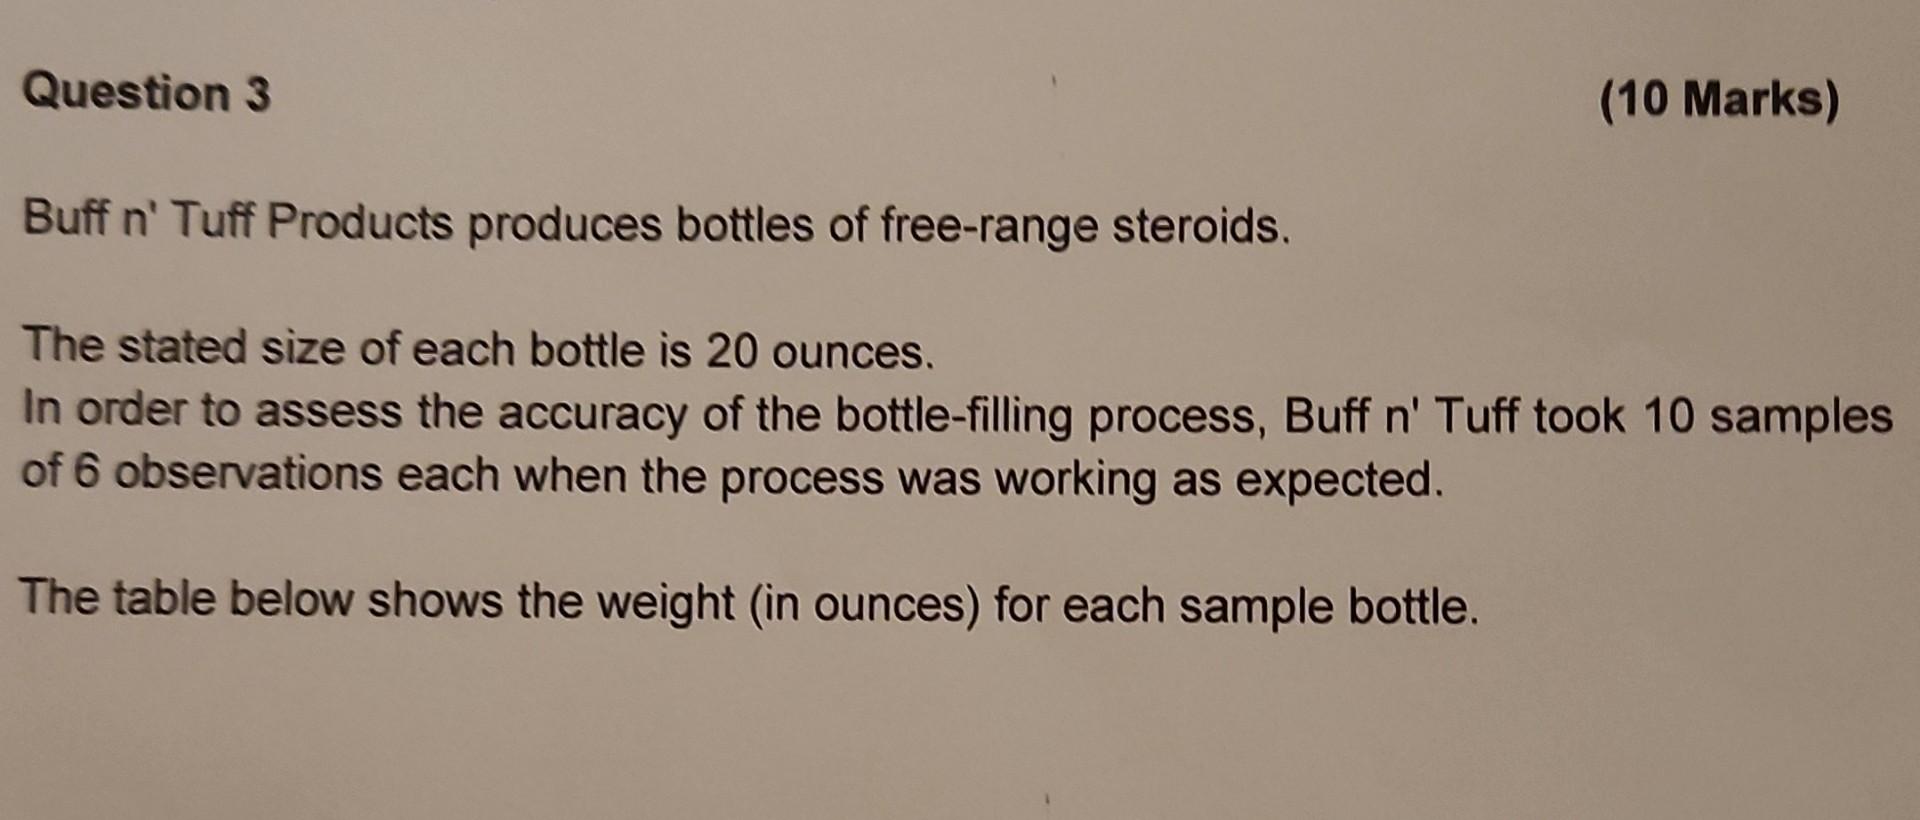
Buff n' Tuff Products produces bottles of free-range steroids. The stated size of each bottle is 20 ounces. In order to assess the accuracy of the bottle-filling process, Buff n Tuff took 10 samples of 6 observations each when the process was working as expected. The table below shows the weight (in ounces) for each sample bottle. Buff n' Tuff Products produces bottles of free-range steroids. The stated size of each bottle is 20 ounces. In order to assess the accuracy of the bottle-filling process, Buff n Tuff took 10 samples of 6 observations each when the process was working as expected. The table below shows the weight (in ounces) for each sample bottleStep by Step Solution
There are 3 Steps involved in it
Step: 1

Get Instant Access to Expert-Tailored Solutions
See step-by-step solutions with expert insights and AI powered tools for academic success
Step: 2

Step: 3

Ace Your Homework with AI
Get the answers you need in no time with our AI-driven, step-by-step assistance
Get Started


